A Beginner's Adventures in Genetic Genealogy (a work in
progress)
by Paddy Waldron
Last updated: 29 May 2024.
Introduction
The purposes of this web page are two-fold:
- to encourage my relatives and the population at large to submit DNA samples to online
genetic genealogy databases in order to improve everybody's
chances - the chances of all genealogists and particularly of
adoptees and foundlings - of finding cousins in those databases and
proving their relationships to those cousins; and
- to explain for my own benefit, and for that of anyone else who
is interested, the basic statistical and
scientific principles behind the relatively new and
rapidly evolving science of DNA matching.
I have been advised to use a more catchy title. The first suggestion
was “A Mathematician’s Trip into His Family’s past via the Rabbit
Hole of DNA”. Other suggestions are welcome.
Why submit your DNA?
It was only after a lot of thought over a number of years that I
submitted a sample of my own DNA to FamilyTreeDNA
(FTDNA) on 20 October 2013, receiving the results on 15 November
2013.
At the time, FamilyTreeDNA was really the only practical and
affordable option for those residing outside the United States of
America, where the first three big DNA companies were based. The
alternatives at the time were AncestryDNA
and 23andMe.
The basic selfish reasons that motivate most people to submit DNA
samples to a genetic genealogy database are to confirm their own
genealogical relationships and to find their own long lost
cousins.
However, you should consider submitting your DNA not just for
your own benefit, but for the benefit of others, including those
only distantly related to you. You can rest assured that your own
descendants will be literally eternally grateful to you for doing
so. It is much cheaper and easier to do it now than for your
survivors to do it when you are dead. Even if submitting your
DNA doesn't help you directly, you might have the missing jigsaw
pieces that will solve someone else's mystery. Genetic
genealogy databases are of particular value to those who don't
know much about their biological ancestry due to adoption,
abandonment, infidelity, sperm or egg donation and similar causes.
The value of an online genetic genealogy database to those
searching for relatives depends fundamentally on the number of
people in the database. The first to join do need to make a leap
of faith and exercise patience until the database reaches critical
mass. When you do join, there are huge positive externalities for
those already in the database and also for those who join
subsequently. If your close relatives are not in the database,
then you cannot be matched with them. If your close relatives are
already in the database, then by joining you are presenting them
with a valuable and much appreciated gift.
The first three major genetic genealogy companies were all based
in the USA and some either do not welcome DNA samples from outside
the USA or have a pricing policy designed to rip off those
resident outside the USA. For those whose roots are in the USA,
the databases were already approaching critical mass by 2014.
Critical mass for those in countries like Ireland, where I live,
was much further off when I submitted my sample. Someone has to
get the ball rolling, so why not you? If members of your extended
family (like all families in Ireland) emigrated to the USA, then
you already have a good chance of finding their descendants. And
you may even find cousins among the early participants from other
jurisdictions. Or you may just help distant relatives without a
well documented family tree to focus their searches in the correct
direction, whether that is on your own branch of the family or on
another branch of the family.
On the other hand, if there is a family secret that you, or
others in your family, would like to remain a secret, then genetic
genealogy may not be for you. Conversely, if you feel that now is
the time to bring the family secret into the open and obtain
closure for all involved, then genetic genealogy is definitely the
way to go.
Genetic genealogy can also reveal family secrets that nobody ever
suspected, for example an inadvertent baby swap at Fordham
Hospital in The Bronx in 1913 which went unnoticed for over a
century.
In fact, a disproportionate number of those resorting to DNA to
trace their family history are adoptees, or parents or descendants
of adoptees, or even foundlings with no paper trail at all on
their biological family. I will do my best to assist and advise
any such people among my own DNA matches, insofar as this is
possible without putting unwanted pressure on those on the other
side of the family secret who may want to keep it a secret. Doing
my best includes encouraging all my relatives to submit DNA
samples to one of the DNA companies so that I will be able to tell
those with matching DNA and no paper trail as precisely as
possible on which side of my ancestry they are likely to be
related to me.
I also have my own, possibly selfish, reasons for wanting my own
relatives to join a genetic genealogy database. Having submitted
my own DNA, I now want to compare my results with those of:
- known relatives whose precise genealogical relationship
to me is proven;
- probable relatives whom I know personally and with whom
I suspect that I have a genealogical relationship, still
unproven; and
- possible relatives whom I do not know personally but
whose DNA results suggest that there is a significant
probability, small or large, that we have a genealogical
relationship, close or distant, but also unproven.
If you are reading this, then there is a fair chance that you are
already in one of these categories, so please read on! Even if you
have no reason to suspect that you are closely related to me, I
hope that what follows will help your understanding of what you
can learn from your own DNA results.
If you belong to one of the first two categories and you have
already submitted a sample of your DNA to one of the DNA
companies, then please get in touch so that we can compare
results. If you belong to the third category, then we will be
automatically put in touch through either the databases maintained
by the DNA companies or a third party database like GEDmatch.com (to which you
should copy your results right now, if you have not already done
so). However, if you have not published the information that you
already have on the relevant website, or explained in your profile
why you have not done this, then I will assume that you are not
sufficiently interested in your ancestry to want to correspond
further with me.
To be a successful genealogist, you must record what you know of
your relatives in a good software package, offline (preferably) or
online (if you have very fast broadband and more faith than I do
in cloud computing, and trust your online service provider and
your cloud data not to evaporate, as my Vodafone e-mail,
mundia.com messages, etc., have done). I use Ancestral
Quest. All good genealogy software packages will export
selected information, typically just names, dates and places for
your direct ancestors, to a GEDCOM file (a standardised format for
exchange of genealogical data) which can be uploaded to the
relevant DNA website. When a FamilyTreeDNA customer uploads a
GEDCOM file, the list of ancestral surnames on the FamilyTreeDNA
profile is automatically populated, but the names of your most
distant known patrilineal and matrilineal ancestors must be
entered separately. You must also link the DNA sample to the
correct individual in the family tree. I have a seen a few cases
of DNA data purporting to be from an individual who has been dead
for hundreds of years, something that is not yet commercially
available. If the family genealogist persuades you to provide a
DNA sample, he or she should be able in return to provide a GEDCOM
file to go with it, although it may initially cover only your
shared ancestors. I have written much more about this here.
At GEDmatch.com, multiple DNA samples can be linked to a single
e-mail address and a single GEDCOM file.
I recognise that there are conflicting opinions on how much
detail adoptees should include on their FamilyTreeDNA profiles;
the onus is on those who choose to leave their profiles blank to
initiate contact with all their possible relatives. My general
guidance for those aiming to reunite families separated by
adoption, whether using DNA or more conventional methods, is not
to rush in without the advice
of an experienced genetic genealogist and/or an
experienced social worker, as there will only be one
chance to make the critical first contact a success.
If you are one of my known or probable relatives and you have not
yet submitted a DNA sample to one of the DNA companies, then
please consider doing so.
As of 7 June 2018, the two best
initial options are:
- For USD69 [Father's Day sale price] plus taxes plus shipping
plus a possible surcharge for ordering from outside the U.S. or
having a non-U.S. address plus recurring annual membership fees,
use AncestryDNA.com; or
- For a one off payment of USD79 [regular price] or USD59
[Father's Day sale price] plus shipping, use Family Finder which
can be ordered from https://www.familytreedna.com/family-finder-compare.aspx#/shoppingCart?pid=215
Other
websites may provide more up-to-date pricing information.
FamilyTreeDNA is clearly less expensive, particularly for those
outside the USA and for those not already paying annual membership
fees to ancestry.com. FamilyTreeDNA also has the advantage of
geographic and surname projects and Y-DNA and mitochondrial DNA
products. However, AncestryDNA has a much bigger customer
base (over 5 million as of August 2017, about five
times the size of FTDNA, but representing only 30 countries as of October
2016) and will probably find you more relatives. The choice
is yours. If you choose AncestryDNA, you can still join the
FamilyTreeDNA database via the free autosomal transfer. However, you will
need to send a second sample direct to FamilyTreeDNA for Y-DNA or
mitochondrial DNA analysis.
There are a growing number of DNA comparison websites and those
interested in finding long-lost relatives should be in all of
them. While helping an adoptee who is married to a Murphy, I
coined what I have called Murphy's Law of Genetic Genealogy:
If there are N DNA comparison websites and your DNA is
in N-1 of them, then your most important match will be in the Nth.
In the words of another widely used metaphor, there are many
online gene pools out there and there are many people who are in
only one or two of them; for maximum effect, you must fish in all
of these pools.
I strongly urge all those who have sent DNA samples to
AncestryDNA and those who sent DNA samples to 23andMe between
November 2010 and August 2017 to transfer their autosomal DNA data to
FamilyTreeDNA.com if they do not already have a Family Finder
presence. You may find new long lost relatives who have sent
their DNA to FamilyTreeDNA but have not yet transferred their data
to GEDmatch.com. This free service was announced on 16 February
2017.
If you have used FamilyTreeDNA for Y-DNA or mitochondrial DNA but
used one of the other companies for autosomal DNA, then this
advice also applies to you.
Before May 2016 (see here), AncestryDNA and FamilyTreeDNA used
the same set of autosomal SNPs, so importing AncestryDNA data to
the FamilyTreeDNA database and running comparisons was
straightforward. After AncestryDNA changed to a different and
smaller set of autosomal SNPs, it took nine months to develop a
new matching algorithm.
Whichever DNA company you use, you can copy your results file to www.gedmatch.com
for free to compare with people who have used the other lab (or
23andMe.com, which is a poor third from a genealogical
perspective).
End-of-year sales have become an annual tradition in the world
of genetic genealogy. For the end-of-2013 sale, a USD100
restaurant.com gift card and Family Finder Testing together cost
only USD99, so those living in the USA who like eating out could
actually profit by USD1 by submitting DNA samples! While this
particular offer is unlikely to be repeated, keep an eye out for
other special offers. Prices are also traditionally cut around DNA
Day (25 April), Mother's Day in the United States (the
second Sunday of May) and Father's Day in the United States (the
third Sunday of June).
The more remote our known connection, the more interesting I
think the results will be.
On my paternal side, I am naturally
interested in exploring the various origins of the Waldron surname
in Ireland. If you are a male Waldron with Irish roots, I
particularly urge you to please consider purchasing a
kit! In this case, I initially recommend not Family Finder
Testing but the Y-DNA37, Y-DNA67, Y-DNA111 or Big Y-700 products,
whichever suits your budget. I would love to see some other Irish
Waldron ancestors listed in the Paternal Ancestor Name column on The
WALDRON
Surname DNA Project - Y-DNA Colorized Chart (where I am kit
number 310654). If you are a male Waldron and are already a
FamilyTreeDNA customer, please click the Join Request link on this page to join the
project. My genealogical research has been stuck for many decades
at my GGgrandfather Thomas Waldron (c1825/6 Roscommon-1902
Limerick). I would love to find a Waldron Y-DNA match to give me
some idea where I should be looking in order to go back another
generation. Likewise, I would love to find more Irish Waldron
Y-DNA non-matches in order to rule out some of the wild goose
chases on which I have gone over the years.
Also on my paternal side, I am particularly interested in
exploring my relationship to a number of reputed fifth cousins,
whom I know about from notes in my County Clare grandmother's
diaries and in her letters about meetings with various sets of her
third cousins. In particular, these include the Nolans of Kilkee,
the Houlihans of Killard, the Burkes of Cloonnagarnaun and their
apparent descendants the O'Maras and O'Connells of Moveen. While
the family friendship with all of these families remains strong
down to the present day, nobody remembers any longer who our
common ancestors were, and furthermore the genealogical records
which might unlock these secrets have not survived. There are also
the Clancys of Cranny who remained the closest of friends with the
Clancys of Killard (one of whom was my greatgrandmother) long
after the details of their relationship were forgotten. If you
belong to one of these families, I particularly urge you to please
consider purchasing
a
kit and ordering Family Finder Testing! I also encourage all
Clancys to order Y-DNA analysis. If you have any ancestors from
any part of County Clare, then as soon as you get a password for
your FTDNA kit, I recommend that you visit the Clare
Roots project Activity Feed and hit the JOIN button at the
top right. (Disclaimer: I am Administrator of this project.
Project administrators can see your DNA results when you join
their projects and can help you to interpret them.)
Finally on my paternal side, DNA helped to confirm the relationship between the
Blackalls and Clancys of Killard in County Clare.
Similarly, on my maternal
side, I am particularly interested in exploring whether my
grandparents (both Durkans by birth) or my grandfather's
parents (also both Durkans by birth) might have been related other
than by marriage. Both couples lived in the townland of Cuilmore
(the one in the civil parish of Kilconduff in County Mayo). I
would also like to explore how my mother was related to her "Aunt
Ellie" McDonagh, who clearly wasn't a genealogical aunt, but did
have a Durkan grandmother. Aunt Ellie was from the townland of
Cuillalea in County Mayo, from an area apparently known locally as
Cartoonbawn or Cortoonbawn or Cortoon Bawn or Ballincurry or
Ballinacurry, or however you would like to spell it yourself. If
you are connected to the Durkans or to the McDonaghs, please
consider purchasing
a
kit and ordering Family Finder Testing! [Sending my DNA to
AncestryDNA in 2015 threw up a critical clue
in the "Aunt Ellie" mystery.] I am not yet aware of a County Mayo
project at FTDNA, but would love to see one started.
If you descend from any of these families and have already
submitted a DNA sample, then please copy your raw data to
GEDmatch.com and let me know your GEDmatch kit number; mine is
VA864386C1. I am aware of at least one Nolan descendant and of
several Houlihan descendants who have submitted DNA samples but
have not yet sent me a GEDmatch kit number.
On all sides, for reasons which will become clear as you read on,
I would like to have the DNA of at least eight third cousins
available for comparison, at least one of them descended from each
pair of my greatgreatgrandparents.
I have prepared this web page in an effort to help my known and
probable and possible relatives, and anyone else who is
interested, to understand the rapidly evolving, but often poorly
explained and poorly understood, discipline of genetic
genealogy. It may even be of help to the service providers
struggling to help their customers to make their way more easily
up the steep learning curve that I have experienced in my own
adventures in genetic genealogy. I certainly hope that it will
help customers and FamilyTreeDNA itself respectively to get more
out of the FamilyTreeDNA.com website
and to fix some of its shortcomings.
If you fall into one of the categories of my known, probable or
possible relatives and would like to consult my password-protected
online family tree, please read on or scroll down to the end of
this web page for details of how to obtain a password.
Some people are reluctant to submit DNA samples to commercial
organisations and/or to submit the resulting raw data to third
party DNA-comparison websites and/or to publish kit numbers which
would allow strangers to do one-to-one DNA comparisons, often for
reasons that they cannot articulate. For example, one person considered it a bad idea to
publish GEDmatch kit numbers in a closed facebook.com group with
only 2,824 members, monitored by a handful of administrators of
great integrity. Any information posted in such a group is
far less public than information that is posted at GEDmatch.com
itself, where the audience is orders of magnitude larger and
registration is automated and not monitored. All
GEDmatch.com users have already happily handed over their actual
DNA to a commercial organisation and handed over all the raw data
extracted from it by the commercial organisation to GEDmatch, so
there is no reason to think that merely giving the kit number in a
closed facebook group is a bad idea. Of course, DNA may
reveal unknown or unsuspected relationships, but GEDmatch.com
users must have been aware of that before sending off their
samples, and we cannot change history. Those whose genetic
ancestry has been concealed from them have a right, and usually a
great desire, to know it.
The genetic locations examined for genealogical purposes are
generally not the same as the genetic locations that have been
examined for evidence of possibly elevated risk of certain
diseases. It is widely believed that some individuals have "good
genes" and are likely to live longer, and other individuals have
"bad genes" and are likely to suffer more ill health. The margins
of error associated with health predictions derived from DNA are
just as hard to find, and probably just as large, as the margins
of error associated with the estimated ethnicity percentages
derived from DNA and peddled by many DNA companies.
Revealing to insurers and financiers that one has good genes is
likely to make one's health care less expensive and one's pensions
more expensive, and conversely revealing that one has bad genes is
likely to make one's pensions less expensive and one's health care
more expensive. If an insurance company got its hands on one's raw
data (which it certainly wont do merely by knowing the
GEDmatch.com kit number), it might wish to reduce premiums for
illness and death insurance, as I call them, and increase premiums
for pensions, or vice versa. (The marketing people call these
products health and life insurance, but somehow still market fire
and theft insurance!) In many jurisdictions (certainly in
the U.S.), law prohibits insurance companies from charging higher
premiums to those whose bad genes put them at higher-than-average
risk of certain diseases. This is referred to as
"non-discrimination", although the law actually discriminates
against those whose good genes put them at lower-than-average risk
of the same diseases, by forcing them to pay the same as if they
were at average risk.
Others worry that DNA samples sent to genetic genealogy companies
may be used, with or without search warrants, to identify them or
their close or distant relatives as suspects for criminal
offences. Those of us who are not criminals need not worry about
our DNA being used to convict us of crime. Those who don't trust
the courts and juries to see reasonable doubts in DNA evidence
probably don't trust courts and juries to process other types of
evidence fairly either. The DNA locations used to uniquely
identify criminal suspects beyond reasonable doubt are the
fastest-mutating locations, large numbers of which are unlikely to
be the same for any two individuals bar identical twins. The DNA
locations used to identify closely related individuals are
slower-mutating locations, which are very likely to be the same
for those who are closely related.
This long introduction may have raised lots of questions in the
minds of readers. Please read on for the answers to those
questions.
Statistical
and Scientific Principles
Table of contents
[The text of these chapters still needs to be embellished with
many more illustrations, which I might have to borrow from someone
like Maurice Gleeson!]
Other internal links:
Thoughts and questions on DNA, sampling, testing and marketing
Background
Having been increasingly addicted to genealogy from the age of 12
or earlier and having a degree in mathematical sciences with a
particular interest in probability and statistics, it was
inevitable that I would develop an interest in DNA and in genetic
genealogy.
I attended various one-off lectures on these subjects over a
number of years, and read lots of explanations, often ending up
more confused rather than less confused after an effort to improve
my understanding. I have still not found the inspirational book or
inspirational teacher that suddenly fits everything into place
within the context of my prior knowledge, such as happened with
probability and statistics when I took Adrian Raftery's course
(251) as a third year undergraduate at Trinity College Dublin back in
1983/4. (In the genetic genealogy field, my brief exposure to
lectures by Maurice
Gleeson and Dan Bradley has, however, helped a lot.)
The more I have read, the more sceptical I have become about the
lack of scientific and statistical rigour in genetic genealogy and
about some of the inferences apparently drawn from DNA evidence,
to the extent that I considered entitling this web page "A
Sceptic's Adventures in Genetic Genealogy". Then I discovered that
there is an ongoing
debate about whether the second letter of sceptic should be
a C or a K and whether the spelling difference reflects a slight
nuance in the meaning of the word rather than merely the side of
the Atlantic Ocean on which I grew up! When I was publicly accused
of being a DNA "Luddite", I thought I should perhaps put that word
in the title, or perhaps just admit to being "confused", but I
eventually settled for the more neutral "beginner".
My scepticism made me reluctant to submit my DNA for analysis,
and I continue to exercise caution rather than jump to unwarranted
conclusions on the basis of sloppy statistical analysis, sloppy
science and sloppy explanations, all of which I still believe are
typical of the DNA industry.
On the third day of the joint Back To Our Past (BTOP)
and Genetic
Genealogy Ireland 2013 shows at the Royal Dublin Society (20 Oct 2013), Kathy Borges
of the International
Society of Genetic Genealogists (ISOGG) eventually did
persuade me to purchase Y-DNA and autosomal DNA products from
Family Tree DNA. Notification arrived by e-mail that my autosomal
DNA results were available online on 16 Nov 2013 and that my Y-DNA
results were available online on 21 Nov 2013.
I should probably try to weave my initial thoughts and the
answers that I have found to my questions into the ISOGG Wiki,
but for now I still have more questions than answers and it is
much quicker and easier to post them all together here on this
single web page on my own personal web site documenting my own
adventures as a sceptic in genetic genealogy.
Perhaps I should go and study the subject formally somewhere like
The
Mathematical Genetics Group at the University of Oxford.
I hope that this chapter will help to dispel
some myths, in particular about the need for a little jargon, and that the next chapter will get me some feedback
about interpreting my own autosomal DNA
results, or lack thereof. To begin with, however, some
definitions will help to add some rigour.
Definitions
Basics
My good friend Kevin O'Brien summarised the difficulties of DNA
research succinctly in one sentence:
"This DNA research is different from tracing and is more like
geometry as you are given the answer and then you have to prove
the theorem."
To prove the theorems, one must understand a few
essential
basic
concepts.
If you are reading this page, you hopefully have some basic
understanding of DNA and of genetic genealogy. For those who
don't, I had better begin by outlining some basic definitions.
DNA (short for deoxyribonucleic acid) is material
contained within human cells (and the cells of any living
organism) and inherited by children from their parents. Genetic
genealogy is the use of variations in DNA between
individuals in order to assist genealogical research. For the
purposes of genetic genealogy, DNA is represented by long strings
of the letters A, C, G and T, for example ACCTGAGTCAGTAC. As far
as genetic genealogy is concerned, the precise details of the
chemical structures which these four letters represent are
unimportant. (If you must know, they are initials representing the
four bases adenine (A), cytosine (C), guanine (G) and thymine
(T).)
As an occasional computer programmer, I like to describe
something like ACCTGAGTCAGTAC as a string of letters and
something like GTCAGT as a substring of ACCTGAGTCAGTAC.
The words sequence and subsequence may be used by
others as synonyms of string and substring.
A person's genome is the very long string containing his
or her complete complement of DNA. For the purposes of genetic
genealogy, various shorter strings from within the genome will be
of greater relevance. These shorter strings include, for example,
chromosomes, segments and short tandem repeats (STRs).
The human genome is made up, inter alia, of 46 chromosomes.
The FTDNA
glossary (faq
id:
684) defines a DNA segment as "any continuous run or
length of DNA" "described by the place where it starts and the
place where it stops". In other words, a DNA segment runs from one
location (or locus) on the genome to another
location. For example, the segment on chromosome 1 starting at
location 117,139,047 and ending at location 145,233,773 is
represented by a long string of 28,094,727 letters (including both
endpoints).
For simplicity, I will refer to the value observed at each
location (A, C, G or T) as a letter; others may use
various equivalent technical terms such as allele, nucleotide
or base instead of 'letter'.
The FTDNA glossary does not define the word block, but
FTDNA appears to use this word frequently on its website merely as
a synonym of segment.
A short tandem repeat (STR) is a string of letters
consisting of the same short substring repeated several times, for
example CCTGCCTGCCTGCCTGCCTGCCTGCCTG is CCTG repeated seven times.
A gene is any short segment associated with some physical
characteristic, but is generally too short to be of any great use
or significance in genetic genealogy.
Every random variable
has an expected value or
expectation which is the
average value that it takes in a large number of repeated
experiments. For example, if an unbiased coin is tossed 100 times,
the expected value of the proportion of heads is 50%. Similarly,
if a person has many grandchildren, then the expected value of the
proportion of the grandparent's autosomal DNA inherited by each
grandchild is 25%. Just as one coin toss does not result in
exactly half a head, one grandchild will not inherit exactly 25%
from every grandparent, but may inherit slightly more from two and
correspondingly less from the other two.
There are four main types of DNA, which each have very different
inheritance paths, and which I will discuss in four separate
chapters later:
- Y-DNA
- A human being's 46 chromosomes include two sex chromosomes.
Males have one Y chromosome containing Y-DNA and
one X chromosome containing X-DNA. Females have
two X chromosomes, but do not have a Y chromosome. Y-DNA is
inherited patrilineally
by sons from their fathers, their fathers' fathers, and so on,
"back to Adam". (Most geneticists are not creationists, but the
concept of "Adam" is still useful and used. However, there is a
subtle difference. The "biblical
Adam" was the first and only male in the world at the
time of creation. The "genetic
Adam", the most recent common patrilineal ancestor of
all men alive today, was merely the only male in the world in
his day whose male line
descendants have not yet died out. There were almost
certainly many other males alive at the same time as genetic
Adam who have no male line descendants alive today. Just think
through the men in your grandparents' or greatgrandparents'
generation to get a feel for how precarious the survival of the
male line is through even a handful of generations. Or think of
the surnames of your distant ancestors which no longer survive
as surnames of your living cousins.)
Some people are actually confused by the simple concept that
Y-DNA follows the male line, and even by the simpler concept
that in most cultures the surname follows the same male line. If
you belong to (or join) the relevant facebook groups, you can
read about examples of this confusion in discussions in the County
Clare
Ireland Genealogy group, the County
Roscommon,
Ireland Genealogy group and The
Waldron
Clan Association group. Another interesting
discussion concerns whether those confused by poor
explanations about the inheritance path of Y-DNA are more likely
to be those who don't themselves have a Y chromosome!
- X-DNA
- Every male inherits his single X chromosome from his mother.
Every female inherits two X chromosomes, one each from her
father and from her mother. The X chromsome inherited from the
mother is usually further broken down, because it is one of the
chromosomes subject to the random process of recombination,
into smaller segments represented by shorter strings of A, C, G
and T. In this context, recombination is the process by which
the X chromosome inherited from the mother crosses over randomly
along its length from being a copy of that inherited by the
mother from the maternal grandfather to being a copy of that
inherited by the mother from the maternal grandmother or vice
versa. Thus, the segments in the X chromosomes which everyone
inherits from his or her mother are expected to come equally
from both maternal grandparents. The recombination process is
sometimes described as being analogous to shuffling two packs of
playing cards and splitting the combined pack into two equal
halves. Going back another generation, the segments in the X
chromosome which every woman inherits in its entirety from her
father are expected to have originally come equally from two
greatgrandparents, her father's maternal grandparents. While the
average or expected breakdown between the relevant paternal and
maternal sources is 50:50, we will see later than the observed
breakdown can be anywhere between 0:100 and 100:0.
- Autosomal DNA
- Autosomal DNA (or atDNA for short) is inherited by everyone in
the other 22 pairs of chromosomes which are not sex chromosomes.
These autosomal chromosomes are often referred to for
short as autosomes and are numbered from 1 (the longest)
to 22 (the shortest). One chromosome in each pair comes from the
father and the other from the mother. Just like the maternal X
chromosome, all 44 of these chromosomes are subject to
recombination, which means that the segments in each of the 22
paternal chromosomes are expected to come equally from both
paternal grandparents, and those in each of the 22 maternal
chromosomes likewise are expected to come equally from both
maternal grandparents.
- Because of recombination, segments come ultimately from all
ancestors in recent generations, but those large enough to be of
genealogical value can be traced back to a vanishingly small
proportion of the exponentially increasing number of ancestors
in earlier generations.
- "Genealogical value" is not something that can be precisely
defined, but it will be argued below that autosomal DNA contains
a few hundred segments of genealogical value per individual.
- mtDNA
- The nucleus of every human cell contains 23 pairs of
chromosomes, comprising 22 pairs of autosomal chromosomes and
one pair of sex chromosomes. Outside the nucleus, every human
cell also contains mitochondrial DNA (or mtDNA for short).
Similarly to the patrilineal inheritance of Y-DNA from male to
male along the direct male line, mtDNA is inherited matrilineally,
but by both sons and daughters along the direct female line,
from their mothers, their mothers' mothers, and so on, "back to
Eve". Although it is also passed from female to male, the males
do not transmit it further.
While autosomal DNA comes equally from both parents, this is not
true of DNA as a whole. Not only does mtDNA come from the mother
only, but we will also see below that the Y chromosome is much
shorter than the X chromosome. Thus everyone inherits slightly
more DNA from the mother than from the father, and this is
particularly true for men.
The first exposure to DNA analysis for some readers may have been
the two-part Blood Of The Irish television documentary first
broadcast in 2008. The second part can be viewed on YouTube. The
genetic narrative jumps back and forth, without any explanation,
between Y-DNA and mtDNA. The climax of the programme was the
revelation that three children from a sample of unspecified size
from Carron and Kilnaboy in County Clare had similar mitochondrial
DNA to ancient remains found in a nearby cave, estimated to be
3,500 years old.
The objective of the programme may have been to investigate
whether the direct male line and direct female line ancestors
thousands of years ago of those living in Ireland today were men
and women who also lived in Ireland thousands of years ago.
However, much of the programme appeared to assume that this
desired conclusion had already been proven, and to extrapolate
from the direct male line and.direct female line ancestors to
the billions of other ancestors living at the same time.
There have been great scientific, technological and commercial
advances in the world of DNA analysis since 2008, but, even by the
standards of its time, this programme left much to be desired.
Tips for computer
programmers
If you are not a computer programmer or software developer, then
you may want to skip ahead to the next section
on mutation.
Traditional genealogy applications will produce pedigree charts
and descendancy charts for any individual in a GEDCOM file showing
respectively all the ancestors from whom the root individual may
have inherited autosomal DNA and all the descendants to whom the
root individual may have passed on autosomal DNA (and their
spouses). These charts were probably not designed with autosomal
DNA in mind. It is just coincidence that one can potentially
inherit autosomal DNA from all of one's ancestors, and that one
can potentially pass on autosomal DNA to all of one's descendants.
I am still looking for a genealogy application which will produce
similar pedigree charts and descendancy charts showing the
inheritance paths of the other three types of DNA. For example, an
X pedigree chart should show just the ancestors from whom the root
individual could have inherited segments of X-DNA and an X
descendancy chart should show just the individuals to whom the
root individual might have passed on segments of X-DNA.
Blank X descendancy charts are widely available, but software to
fill them in for specific individuals is hard to find.
It is surprising that even GEDmatch.com has not as of September
2014 implemented X pedigree charts.
Back in 1991, I wrote a program myself to produce descendancy
charts showing only descendants inheriting the Y chromosome from
the root individual, but it assumed the underlying database was in
the original PAF format and contained less than 32K individuals,
so is hardly worth resurrecting now (as PAF has been discontinued
and had switched to a new format before its discontinuation, and
as my own database is now several times that maximum size limit
and as it has become almost impossible to find a PASCAL compiler
for a modern computer).
My hope is that these charts can be most easily added to TNG which I use for my own
genealogy website. I have started a discussion of this topic in the TNG forums.
Programmers working on genealogy software may be interested in
the minor modifications to existing code required to provide these
options. A new variable with four possible values (Y, X, autosomal
[the current default] and mt) is required. Four cases must be
dealt with depending on the value of this new variable. The
default autosomal case remains unchanged, certainly if there is
already a choice as to whether spouses of descendants (who clearly
do not inherit the root individual's autosomal DNA) are included
or omitted. The other three cases are dealt with as follows:
- Y inheritance path
- For the pedigree chart, just follow the direct male line in a
single column format.
- For the descendancy chart, insert something along these lines:
-
IF descendant is female THEN
	proceed to next descendant
ELSE {descendant is male}
	output descendant
	stack descendant's children for later processing
	proceed to next descendant
- X inheritance path
- For the pedigree chart, insert something along these lines:
-
IF ancestor is female THEN
	stack ancestor's father and mother for later processing
	output ancestor
	proceed to next ancestor
ELSE {ancestor is male}
	stack ancestor's mother for later processing
	output ancestor
	proceed to next ancestor
- For the descendancy chart, insert something along these lines:
-
IF descendant is female THEN
	output descendant
	stack descendant's children for later processing
	proceed to next descendant
ELSE {descendant is male}
	output descendant
	stack descendant's daughters for later processing
	proceed to next descendant
- "Cascading" X-descendants charts would also be a nice feature,
i.e. going back generation by generation, a descendants chart
for each X-ancestor, showing those of his or her X-descendants
not yet shown on a previous X-descendants chart. The full set of
these cascading X-descendants charts would show all the cousins
with whom one could theoretically share X-DNA.
- It has been suggested
that Charting
Companion "can automatically color all your X-chromosome
ancestors in your Ancestor charts & Fan charts" although I
can find no mention of this on the product's own website.
Blaine
Bettinger has written an article on Unlocking
the
Genealogical Secrets of the X Chromosome in which he
includes nice colour-coded blank fan-style pedigree charts
showing the ancestors from whom men and women can potentially inherit X-DNA.
- mt inheritance path
- For the pedigree chart, just follow the direct female line in
a single column format.
- For the descendancy chart, insert something along these lines:
-
IF descendant is male THEN
	output descendant
	proceed to next descendant
ELSE {descendant is female}
	output descendant
	stack descendant's children for later processing
	proceed to next descendant
Ann
Turner did this for the MS-DOS version of Personal
Ancestral File (PAF) away back in 1994.
The letters observed at each location on a child's genome are
typically inherited unchanged (other than by recombination) from
one or other parent.
A son inherits his Y chromosome and one set of 22 autosomes
virtually unchanged from his father and inherits his X chromosome,
his mitochondrial DNA and another set of 22 autosomes virtually
unchanged from his mother.
Similarly, a daughter inherits one X chromosome and one set of 22
autosomes virtually unchanged from her father and inherits her
mitochondrial DNA, another X chromosome and another set of 22
autosomes virtually unchanged from her mother.
However, isolated mutations, essentially just
transcription errors, can occur.
Mutation rates vary greatly along the human genome.
At most locations on the genome, the mutation rate is effectively
zero and the same letter is observed for all humans.
Some locations have a slightly greater mutation rate, in the
range of one mutation in the entire history of mankind. Such
locations on the Y-chromosome and in mitochondrial DNA are very
useful for slotting individuals into the appropriate locations on
the relevant evolutionary tree or phylogenetic tree. While
a great deal of effort has gone into identifying such locations,
they are not useful for practical genealogical purposes, as two
individuals with the same letters at a set of such locations may
still not have any common ancestor within thousands of years. By
2015, hopes were high that some surname-specific Y-DNA mutations
might soon be identified.
If locations have a higher mutation rate, perhaps as high as
1-in-20 or even 1-in-10 reproductions, then comparing the letters
observed at a set of such locations can have great genealogical
value. Two individuals with the same observations at a set of such
fast-mutating locations are very likely to have a relatively
recent common ancestor or common ancestral couple.
Estimation of the time to most recent common ancestral couple
depends crucially on both the number of locations compared and on
the estimated mutation rates for each of those locations, based on
research involving many parent/child observations.
There are two different basic units in which the length
of a segment of DNA is frequently measured, and a third unit used
only for the types of DNA which are subject to recombination,
namely autosomal DNA and X-DNA:
- base pair (bp)
- Each chromosome comprises two complementary strands of
DNA, known as the forward strand and the reverse
strand, and entwined in the shape of a double helix,
which looks like a twisting or rotating ladder. If the letters
in one of the complementary strands are known, then those in the
other can be deduced, since A can pair only with T and C can
pair only with G. A base pair, sometimes called a Watson-Crick
base pair, comprises a letter from the forward strand and
the corresponding letter from the reverse strand. So the value
of a base pair can be one of AT, TA, CG or GC. Similarly, for
example, the substring TTAACGGGGCCCTTTAAATTTAAACCCGGGTTT in one
strand must pair with the substring
AATTGCCCCGGGAAATTTAAATTTGGGCCCAAA in the other strand. For the
purposes of genetic genealogy, once the string of letters
representing the forward strand is known, the information in the
reverse strand is redundant. Nevertheless, the phrase base
pair is used as the fundamental unit in which the length
of a DNA segment is measured.
- Don't be confused by the fact that autosomal chromosomes come
in pairs (the paternal chromosome and the maternal
chromosome) and that each of these chromosomes in turn
contains two strands of DNA (the forward strand and the
reverse strand). Thus, one person's autosomal DNA
comprises 22 pairs of chromosomes, 44 chromosomes or 88 strands
of DNA. When comparing two people's autosomal DNA, one is
looking at 44 pairs of chromosomes, 88 chromsomes or 176 strands
of DNA.
- One thousand base pairs is a kilobase (kb) and one
million base pairs is a megabase (Mb).
- (The length in base pairs of the genome is referred to as the
physical map length.)
- single-nucleotide polymorphism (SNP)
- As already observed, the vast majority of the base pairs in
the genome of most humans are identical.
- A single-nucleotide polymorphism, abbreviated SNP
and pronounced snip, is a single location in the genome
where, due to mutations, there is a relatively high degree of
variation between different people.
- The word polymorphism comes from two ancient Greek roots,
"poly-" meaning "many" and "morph" meaning "shape"
(mathematicians reading this will be familiar with the notion of
isomorphism). Each of these roots can be somewhat misleading.
- In the context of a SNP, "many" misleadingly suggests "four",
but typically means "two", as only two of the four possible
letters are typically observed at any particular SNP. These
typical SNPs are said to be biallelic. Those rare SNPs
where three different letters have been found are said to be triallelic.
The word polyallelic is used to describe SNPs where
three or four different letters have been found. See Hodgkinson
and Eyre-Walker (2010). Polyallelic SNPs would be of
enormous value in genetic genealogy, but are rarely mentioned,
other than to acknowledge their existence. Why not?
- Furthermore, since the 1990s, the verb "morph" has appeared
in the English language with a meaning more akin to "change
shape". In this new sense of "morph", "polymorphic" misleadingly
suggests "fast-mutating". In fact, many SNPs are slow-mutating
rather than fast-mutating locations. As already noted, SNPs
where mutations are observed once in the history of mankind are
just as useful for their own purposes as SNPs with greater
mutation rates.
- Like both the propensity for recombination and the propensity
for mutation at individual SNPs, the density of SNPs which have
been identified varies markedly along the genome. Thus, when
looking at DNA which is subject to recombination (X-DNA and
autosomal DNA), the number of consecutive SNPs at which two
individuals match is of greater genealogical significance than
the total number of consecutive base pairs at which they match.
- The number of SNPs identified in a given segment can also vary
between companies, researchers or technologies. Specific SNPs
have been chosen for the Illumina chips as they are
ancestry-informative as distinct from medically informative.
- The SNPs which the DNA companies
examine are not necessarily all the SNPs. In other words, the
locations not examined are not necessarily locations at which
all humans are identical. Thus, it is possible that two people
match at a long sequence of consecutive observed SNPs, but that
there are unobserved SNPs between the observed SNPs at which the
two people do not match. Dave Nicolson
has written a
paper about this.
- centiMorgan (cM)
- Unlike the other two units of measurement, the centiMorgan is
applicable only to the types of DNA which are subject to
recombination, namely autosomal DNA and X-DNA. It can not be
used to measure Y-DNA or mtDNA.
- The propensity for recombination varies along each chromosome.
One can plot the estimated expected cumulative number of
crossovers or recombination events encountered so far against
the location (measured in base pairs) along each chromosome. The
expected number of crossovers encountered between two locations
can be read from the graph. The distance in centiMorgans
between the two locations is just this expected number divided
by 100. (The full unit, the Morgan, is no longer used.)
- As one recombination is expected every 100 centiMorgans, it
follows (because of a mathematical result known as Jensen's
Inequality) that the expected length of the typical segment of
DNA inherited by a child from a parent on a very long chromosome
would be just over 100 cM. Similarly, the expected length of the
typical segment inherited by a grandchild from a grandparent
(with two opportunities for recombination) would be of the order
of 50cM; for a greatgrandchild from a greatgrandparent, of the
order of 25cM, and so on. The next segment in each case will be
inherited from a different ancestor.
- As chromosomes are no longer than a couple of hundred
centiMorgans, segments are broken up by the end of a chromosome
almost as often as by a recombination event, so in practice
average segment lengths are shorter than suggested by the above
rule of thumb.
- If we assume that crossovers are statistically independent,
then it follows that recombination follows what statisticians
call a Poisson process. The number of crossovers in one
generation in a segment of DNA x centiMorgans long has a
Poisson probability distribution with parameter x/100.
The number of crossovers in n generations in a segment
of DNA x centiMorgans long has a Poisson probability
distribution with parameter n*x/100.
- For example, the probability of no crossover in 299.6cM is 5%.
This result is worth remembering, as it can be used in many
ways. If you share a segment of, say, 30.98 cM with another
randomly selected person, then you can deduce that there is only
a 5% probability that this segment has gone through ten or more
reproductions without recombination (since 299.6/30.98 is just
under 10). Equivalently, there is a 95% probability that you are
a fourth cousin or closer of the other person.
- Similarly, the probability of no crossover in 69.3cM is 50%.
- The abbreviation cM (with a capital M) is used to distinguish
the centiMorgan from the centimetre (abbreviated cm with a small
m).
- The number of base pairs to which a centiMorgan corresponds
varies widely across the genome because different regions of a
chromosome have different propensities towards crossover. These
expectations and propensities presumably come from experimental
data and change as more data is collected, so that the
definition of centiMorgan may also vary over time and between
DNA companies using different experimental data. The number of
base pairs per centiMorgan varies both from chromosome to
chromosome and within chromosomes. As can be calculated from the
table below, a centiMorgan in one part of chromosome 3 can be
under 800,000 base pairs, but a centiMorgan in one part of
chromosome 11 can be over 6,000,000 base pairs.
-
| CHROMOSOME |
START LOCATION |
END LOCATION |
LENGTH |
CENTIMORGANS |
| 1 |
44805958 |
47175419 |
2369461 |
1.08 |
| 2 |
106254302 |
116973471 |
10719169 |
8.09 |
| 2 |
157113214 |
159347591 |
2234377 |
2.44 |
| 3 |
11537627 |
12600665 |
1063038 |
1.41 |
| 4 |
165504024 |
167423895 |
1919871 |
2.29 |
| 6 |
29267608 |
31571470 |
2303862 |
1.53 |
| 11 |
46718718 |
56273717 |
9554999 |
1.54 |
| 11 |
103382220 |
105990699 |
2608479 |
2.38 |
| 17 |
36593956 |
38838321 |
2244365 |
1.92 |
- As can be seen from the above table, from the FTDNA
website, when no unit of measurement is specified, length
is apparently assumed to mean length in base pairs.
FamilyTreeDNA and GEDmatch use different centiMorgan
scales. Here's an extreme example from chromosome 9:
FTDNA: 9 81,628,878
90,218,677 18.04 2,500
GEDmatch: 9 81,369,061
90,503,719 13.2 2,433
In base pairs, the GEDmatch length is far longer than the
FTDNA length; but in centiMorgans, the GEDmatch length is far
shorter than the FTDNA length.
- (The length in centiMorgans of the genome is referred to as
the genetic map length.)
If a segment of X-DNA or autosomal DNA has lots of SNPs, then two
people's DNA is unlikely to be identical purely by chance on that
segment.
Conversely, if a segment is small in terms of centiMorgans, then
it wont have seen many recombinations over the generations, and
may have been inherited unchanged from a very distant ancestor,
particularly in the case of X-DNA which is not subject to
recombination when passed from father to daughter.
Thus, to be sure that a segment is inherited from a recent common
ancestor, one would like to see that it is long on both the
centiMorgan and SNP scales.
Given a long shared segement, unless we have a complete pedigree for
both parties going back many generations, it will always be
difficult to know whether the shared segment comes from a known
common ancestor or an unknown common ancestor on some other
ancestral line.
Converting between
units of measurement
There must be plots somewhere showing the monotonic relationship
between the length along each chromosome measured in base pairs,
the length along the chromosome measured in centiMorgans and the
length along the chromosome measured in SNPs, but I have not yet
come across them.
Genealogists are probably used to variables which can be measured
in either of two units of measurement which are linearly
related to each other. For example, those with nineteenth
century rural Irish ancestors will have converted the areas of
their ancestors' landholdings from the Irish acres
generally used in the Tithe Applotment Books to the statute
acres used in Griffith's Valuation using the fixed conversion
ratio 121 Irish acres=196 statute acres. A graph of areas in
Irish acres versus areas in statute acres will look like a
straight line.
For the three units of measurement in which DNA is measured,
there are no such fixed conversion ratios, as the relationships
between the units of measurement are non-linear. The local
conversion ratios between base pairs, centiMorgans and SNPs vary
considerably along the genome. Graphs of the relationship between
base pairs and centiMorgans or between base pairs and SNPs or
between centiMorgans and SNPs will slope upwards, but otherwise
will not look anything like a straight line.
In the absence of such representative graphs, the best that I can
show here is a table based on the local conversion ratios in a
(non-random) sample of 4,339 regions (those where I am half-identical with one or more of my 381
FTDNA-overall-matches as of 10 Jan 2014; by construction, this is
an unrepresentative sample). These may be biased estimates of the
average conversion ratios throughout the genome.
|
bp/cM |
bp/SNP |
SNP/cM |
| Minimum |
112,200 |
118 |
89 |
| Average |
1,413,219 |
2,292 |
331 |
| Maximum |
10,576,336 |
18,786 |
2,384 |
Each of the measurement units defined above
can also be converted into percentages of the total length of the
genome, which are a much simpler way of viewing the results for
autosomal DNA and X-DNA, which both come in segments from multiple
ancestors.
The use of percentages assumes that a precise value of the total
(the denominator in the percentage calculation) is known.
The total length of the human genome in base pairs is
typically imprecisely specified as "over 3 billion DNA base pairs"
(see table in Wikipedia).
This
total length, however, includes only one copy of each of the 22
autosomal chromosomes. The genome actually contains around 6
billion base pairs, as it contains two copies of each autosomal
chromosome. James Michael Connor (Medical Genetics for the
MRCOG and Beyond, RCOG, 2005, page
3) confirms, for example, that there are "280Mb in each copy
of chromosome 1", so that the base pairs figures in the Wikipedia
table clearly represent the numbers of base pairs in one copy of
each autosomal chromosome. Gianpiero
Cavalleri confirms that, roughly speaking, "Each of us
inherits 6 billion letters of DNA, 3 billion from our mother and 3
billion from our father."
Since it is common to speak about the length of DNA, the width
of the human genome can correspondingly be viewed as two base
pairs for the autosomal chromosomes and for a woman's X
chromosomes; elsewhere it can be viewed as one base pair wide. The
following table summarises the details:
|
Male |
Female |
|
Length |
Width |
Total |
Length |
Width |
Total |
| Autosomal |
2,881,033,286 |
2 |
5,762,066,572 |
2,881,033,286 |
2 |
5,762,066,572 |
| X |
155,270,560 |
1 |
155,270,560 |
155,270,560 |
2 |
310,541,120 |
| Y |
59,373,566 |
1 |
59,373,566 |
|
|
0 |
| Mitochondrial |
16,569 |
1 |
16,569 |
16,569 |
1 |
16,569 |
| GRAND TOTAL |
3,095,693,981 |
|
5,976,727,267 |
3,036,320,415 |
|
6,072,624,261 |
Note that the X chromosome contains almost three times as many
base pairs as the Y chromosome, so the total number of base pairs
in the female human genome is greater than the total number of
base pairs in the male human genome.
Despite this confusion about the total length of the genome, the
base pair remains the most precise and unambiguous of the three
units of measurement; however, it is also the least appropriate as
a measure of the genealogical relevance of a shared segment of
DNA.
The total number of cM is also imprecisely specified, apparently
varying slightly from one DNA website to another. Figures for the
length in cM of the autosomal chromosomes only and figures for the
length in cM of the autosomal chromosomes and the X chromosome
combined may be seen and should not be confused. Furthermore, the
definition of the centiMorgan is based on empirical observation of
recombination frequencies, and thus can vary based on the
particular experimental data on which it is based.
The total number of SNPs used by a particular DNA company is at
least directly observable in the raw data downloadable from the
company. For example, my raw autosomal DNA data from
FamilyTreeDNA.com includes precisely 696,752 SNPs, with one letter
from my paternal chromosome and one letter from my maternal
chromosome observed at each SNP. My raw X-DNA data includes one
letter from each of precisely 17,797 SNPs. If I were female, then
I would have another letter from my second X chromosome at each of
these 17,797 SNPs. As with centiMorgans, the definition of SNPs is
based on empirical observation of variation, and thus can also
vary based on the particular experimental data on which it is
based and on the DNA company collecting the data. A location where
no variation is observed in a small sample may exhibit variation
in a larger sample and be reclassified as a SNP. DNA observation
is also subject to measurement error, so there will be occasional
SNPs which result in no calls
so that there can be slight variation in the number of SNPs
observed between different individuals even with the same DNA
company.
For all these reasons, it is critically important to avoid
ambiguity by giving precise details of how the centiMorgan or the
SNP has been defined, including specifying the full length of the
genome and its components according to the relevant definition.
One way of getting a feel for the length of your autosomes in
SNPs and cMs is to do a one-to-one comparison of your own kit with
your own kit at GEDmatch.com.
This table shows my details:
| Chr |
End Location |
Centimorgans (cM) |
SNPs |
bp/cM |
bp/SNP |
SNP/cM |
| 1 |
247,169,190 |
281.5 |
57,186 |
878,043 |
4,322 |
203 |
| 2 |
242,683,192 |
263.7 |
55,850 |
920,300 |
4,345 |
212 |
| 3 |
199,310,226 |
224.2 |
45,709 |
888,984 |
4,360 |
204 |
| 4 |
191,140,682 |
214.5 |
39,248 |
891,099 |
4,870 |
183 |
| 5 |
180,623,543 |
209.3 |
40,685 |
862,989 |
4,440 |
194 |
| 6 |
170,732,528 |
194.1 |
46,476 |
879,611 |
3,674 |
239 |
| 7 |
158,811,958 |
187.0 |
36,759 |
849,262 |
4,320 |
197 |
| 8 |
146,255,887 |
169.2 |
35,757 |
864,396 |
4,090 |
211 |
| 9 |
140,147,760 |
167.2 |
31,717 |
838,204 |
4,419 |
190 |
| 10 |
135,297,961 |
174.1 |
37,783 |
777,128 |
3,581 |
217 |
| 11 |
134,436,845 |
161.1 |
35,392 |
834,493 |
3,799 |
220 |
| 12 |
132,276,195 |
176.0 |
34,384 |
751,569 |
3,847 |
195 |
| 13 |
114,108,121 |
131.9 |
26,933 |
865,111 |
4,237 |
204 |
| 14 |
106,345,097 |
125.2 |
22,630 |
849,402 |
4,699 |
181 |
| 15 |
100,214,895 |
132.4 |
21,052 |
756,910 |
4,760 |
159 |
| 16 |
88,668,978 |
133.8 |
22,030 |
662,698 |
4,025 |
165 |
| 17 |
78,637,198 |
137.3 |
19,564 |
572,740 |
4,019 |
142 |
| 18 |
76,112,951 |
129.5 |
21,052 |
587,745 |
3,615 |
163 |
| 19 |
63,776,118 |
111.1 |
14,454 |
574,042 |
4,412 |
130 |
| 20 |
62,374,274 |
114.8 |
17,887 |
543,330 |
3,487 |
156 |
| 21 |
46,909,175 |
70.1 |
9,948 |
669,175 |
4,715 |
142 |
| 22 |
49,528,625 |
79.1 |
10,112 |
626,152 |
4,898 |
128 |
| All autosomes |
2,865,561,399 |
3587.1 |
682,608 |
798,852 |
4,198 |
190 |
The End Location column may understate the chromosome lengths in
bps, as it probably refers to the location of the last SNP on the
chromosome, and there may several thousand more bps beyond that
last SNP.
Note that the variation in the overall ratios between the
different units of measurement from one chromosome to another is
small compared to the variation between smaller segments
illustrated in an earlier table and that the various ratios are
very different from those in the earlier unrepresentative sample.
While the length in centiMorgans of each chromosome appears to be
the same from one FTDNA customer to another, the number of SNPs
observed on every chromosome varies from customer to customer and
the end locations can also vary in some cases.
Note that for each of the chromosomes, the probability of
recombination is greater than 50%, ranging from 50.4% for
Chromosome 21 to 94.0% for Chromosome 1. Conversely, the
probability of inheriting an entire chromosome intact from one
grandparent ranges from 6.0% for Chromosome 1 to 49.6% for
Chromosome 21.
Although in theory the chromosomes are numbered in order of
decreasing length, this is not the case in the table, where
Chromosome 22 is longer on all three scales than Chromosome 21.
Observing DNA
It is neither practical nor essential nor affordable to observe
all 6,072,624,261 base pairs in the female human genome, as the
vast majority of these have the same value for all women, and
similarly for men.
Instead we just observe the locations which are known to vary
from one person to another.
In the case of autosomal DNA, FTDNA makes observations at 696,752
paternal SNPs and at the corresponding 696,752 maternal SNPs.
For each of the 696,752 locations, two letters are observed, say
A and G, but it is not possible to tell whether the A comes from
the paternal copy of the relevant chromosome and the G from the
maternal copy, or vice versa.
Presumably if we moved along the genome observing every letter
along the way we could keep track of which were the paternal
letters and which were the maternal letters; instead, we pop in
just once every 4000 or so base pairs, at which stage we can no
longer look back and see which is the paternal chromosome and
which the maternal chromosome.
In other words, instead of observing 696,752 ordered pairs
of letters (of which there are 16 possible values, namely any one
of ACGT with any one of ACGT: AA, AC, AG, AT, CA, CC, CG, CT, GA,
GC, GG, GT, TA, TC, TG and TT), since the parental source of the
letters can not be observed, we observe 696,752 unordered
pairs (of which there are ten possible values: AA, CC, GG,
TT, AC, AG, AT, CG, CT and GT).
In other words, observed autosomal DNA is represented not by two
(unobservable) ordered strings of letters, but by one array of
unordered pairs of letters.
The observed unordered data is said to be unphased; the unobservered
ordered data which we would like to have is said to be phased. There are various
limited techniques available for phasing
the unordered data. A certain amount of simple phasing of a
child's data is possible if samples are available from both of the
child's parents. Ancestry.com uses more sophisticated phasing
algorithms, particularly in the new matching process which it
introduced in November 2014.
I took an interest in equine pedigrees from a very young age,
even before I began to be interested in human pedigrees. I have
long taken an interest in the activities of Equinome, a
University College Dublin campus company which claims to have
identified a SNP called the speed gene which predicts a
racehorse's distance perference. It was only when I realised that
the unordered pairs observed at the location of Equinome's speed
gene can be C:C, C:T and T:T that I realised the vast difference
between the two possible A-with-T and C-with-G base pairs in a
single chromosome and the ten possible unordered pairs observed in
maternal and paternal chromosome pairs.
A region is a run of unordered pairs, starting at one
specified locus on a specific chromosome and ending at another
specified locus on the same chromosome. In theory, the region
comprises one DNA segment on the paternal copy of the chromosome
and another DNA segment on the maternal copy of the same
chromosome. In practice, neither of these segments is
independently observed.
Comparing W's DNA and Z's DNA in theory
Consider the comparison between person W's DNA and person Z's DNA
in a particular region on a particular chromosome. (Since the
mathematician's usual generic variables X and Y refer to
chromosomes in genetics, I'll try to avoid confusion by using V, W
and Z instead as variables to denote generic people.)
If we could observe W's paternal segment, W's maternal segment,
Z's paternal segment and Z's maternal segment in this region, then
we could tell whether or not one of W's segments was identical
to one of Z's segments. If we found two matching segments, then we
could state that these segments were identical by
state (IBS) and that W and Z segment-match on
this segment.
Provided that W's paternal segment is different from W's maternal
segment and likewise Z's paternal segment is different from Z's
maternal segment, then we can start to investigate whether these
IBS segments are identical by descent (IBD).
If
- there is a proven family tree connecting W to Z via a common
ancestor;
- we also have DNA samples from the relevant ancestors of W and
Z back to their most recent common ancestor (MRCA)
and from the spouses of those ancestors; and
- the IBS segment matches only one spouse at each generation
back to the MRCA,
then we have proven that the matching segments are IBD. The term
IBD is often loosely used when this level of rigorous proof is
lacking.
Even if no DNA samples are available for some of the people on
the family tree, it may still be possible to prove that the
matching segments are IBD.
More generally, the unavailablility of some DNA samples means
that we can merely draw conclusions about the likelihood
of a hypothesised relationship given the DNA or, equivalently, the
probability of the observed DNA given the hypothesised
relationship.
In general, the longer two IBS segments, the more likely they are
to be IBD.
Since we do not independently observe W's paternal segment, W's
maternal segment, Z's paternal segment and Z's maternal segment in
the region of interest, we must base comparisons on the unordered
pairs that we do observe.
Think of W as yourself and Z as another person who has been
selected at random from a DNA database.
Let us first consider a particular location or SNP.
At this single location, W's unordered pair matches Z's unordered
pair if it is possible that one of W's unobservable segments
matches one of Z's unobservable segments. In other words, they
match if at least one letter is common to both pairs.
Things could get confusing here, as we are comparing two people,
each of whom has a pair of letters at every point on the
chromosome. Remember that pair refers to the two letters,
not to the two people.
For example, at a biallelic SNP, where either A or G can be
observed on each chromosome, the unordered pairs which can be
observed are AA, AG and GG.
- If W is AG, then W automatically matches Z, whether Z is AA,
AG or GG.
- If W is AA, then W matches Z provided that Z is not GG.
- Conversely, if W is GG, then W matches Z provided that Z is
not AA.
To avoid the confusion which would arise if the word 'match' was
used in multiple different senses, we say that unordered pairs
which match in this sense are half-identical pairs and if
their pairs are half-identical, we say that W is
half-identical to Z at this location.
A person whose paternal and maternal letters are the same at a
particular location (AA, CC, GG or TT) is said to be homozygous
(or homozygotic) at that location. A person whose paternal and
maternal letters are different at a particular location (e.g. AC)
is said to be heterozygous (or heterozygotic) at this
location.
At locations which are biallelic (the vast majority), someone who
is heterozygous will automatically be half-identical to everyone.
Thus, observing a heterozygous pair provides no information
whatsoever about the possibility that the two people are related.
All the relevant information comes from locations at which both W
and Z are homozygous, and the few locations which are polyallelic.
If W and Z are homozygous at a particular location, but with
different letters (e.g. W is AA and Z is GG), then they clearly
did not inherit that location from a common ancestor.
However, if W and Z are homozygous at a particular location with
the same latter (e.g. both W and Z are AA), then they may have
inherited their autosomal DNA at that location from a common
ancestor.
When investigating the possibility of a relationship, we can
discard any biallelic SNPs at which either W or Z is heterozygous,
since those SNPs provide no information about the likelihood of a
relationship. We just need to compare the locations at which both
W and Z are homozygous, i.e. their mutually homozygous
locations.
The more consecutive mutually homozygous locations we find, the
more likely it is that the relevant region includes a segment of
DNA inherited from a common ancestor.
To explore the probabilities involved, let us suppose that the
SNP we are considering is biallelic with the proportions p
and 1-p of the population having each value, say A and C
respectively, and correspondingly, assuming independence of
paternal and maternal letters, the proportions p2,
2p(1-p) and (1-p)2 of the population
having each unordered pair, say AA, AC and CC respectively.
If you are homozygous AA at that SNP, then the other person is
half-identical to you unless he or she is CC, in other words
half-identical with probability 1-(1-p)(1-p)=2p-p2=p(2-p).
Similarly, if you are homozygous CC, then the other person is
half-identical to you with probability 1-p2.
If you are heterozygous AC or CA, then the other person is
half-identical to you with probability 1, since everyone is
half-identical to you.
This table shows these probabilities for different values of p,
shown in the first column.
The next three columns show the corresponding proportions of the
population who are homozygous AA (p2),
heterozygous (2p(1-p)) and homozygous CC ((1-p)2).
The second block of three columns shows the probability that a
randomly chosen individual is half-identical to you conditional on
your letters at the relevant location.
The last column shows the unconditional (ex ante)
probability that a randomly chosen individual is half-identical to
you at the relevant location.
Before you see your own results, the last column gives the
relevant probability; once you know your own results, you can
update the probability by looking at the fifth, sixth or seventh
column, whichever is relevant.
| Population Proportions |
Probability random individual half-identical
to: |
| A |
AA |
AC or CA |
CC |
AA |
AC or CA |
CC |
unknown |
| 0.0% |
0.0% |
0.0% |
100.0% |
0.0% |
100.0% |
100.0% |
100.0% |
| 5.0% |
0.3% |
9.5% |
90.3% |
9.8% |
100.0% |
99.8% |
99.5% |
| 10.0% |
1.0% |
18.0% |
81.0% |
19.0% |
100.0% |
99.0% |
98.4% |
| 15.0% |
2.3% |
25.5% |
72.3% |
27.8% |
100.0% |
97.8% |
96.7% |
| 20.0% |
4.0% |
32.0% |
64.0% |
36.0% |
100.0% |
96.0% |
94.9% |
| 25.0% |
6.3% |
37.5% |
56.3% |
43.8% |
100.0% |
93.8% |
93.0% |
| 30.0% |
9.0% |
42.0% |
49.0% |
51.0% |
100.0% |
91.0% |
91.2% |
| 35.0% |
12.3% |
45.5% |
42.3% |
57.8% |
100.0% |
87.8% |
89.6% |
| 40.0% |
16.0% |
48.0% |
36.0% |
64.0% |
100.0% |
84.0% |
88.5% |
| 45.0% |
20.3% |
49.5% |
30.3% |
69.8% |
100.0% |
79.8% |
87.7% |
| 50.0% |
25.0% |
50.0% |
25.0% |
75.0% |
100.0% |
75.0% |
87.5% |
| 55.0% |
30.3% |
49.5% |
20.3% |
79.8% |
100.0% |
69.8% |
87.7% |
| 60.0% |
36.0% |
48.0% |
16.0% |
84.0% |
100.0% |
64.0% |
88.5% |
| 64.6% |
41.7% |
45.7% |
12.5% |
87.5% |
100.0% |
58.3% |
89.5% |
| 65.0% |
42.3% |
45.5% |
12.3% |
87.8% |
100.0% |
57.8% |
89.6% |
| 70.0% |
49.0% |
42.0% |
9.0% |
91.0% |
100.0% |
51.0% |
91.2% |
| 75.0% |
56.3% |
37.5% |
6.3% |
93.8% |
100.0% |
43.8% |
93.0% |
| 80.0% |
64.0% |
32.0% |
4.0% |
96.0% |
100.0% |
36.0% |
94.9% |
| 85.0% |
72.3% |
25.5% |
2.3% |
97.8% |
100.0% |
27.8% |
96.7% |
| 90.0% |
81.0% |
18.0% |
1.0% |
99.0% |
100.0% |
19.0% |
98.4% |
| 95.0% |
90.3% |
9.5% |
0.2% |
99.8% |
100.0% |
9.7% |
99.5% |
| 100.0% |
100.0% |
0.0% |
0.0% |
100.0% |
100.0% |
0.0% |
100.0% |
The first point to note from this table is that for all biallelic
SNPs, you can expect ex ante to be half-identical to at
least 87.5% of the population. This proportion rises if you
subsequently discover that you are heterozygous, or homozygous
with a very common value (>64.6% probability) at the SNP; it
falls if you discover that you are homozygous with a less common
value (<64.6% probability).
At a polyalleic SNP, the probability that W and Z are
half-identical is smaller. (We have already noted that such
locations are very rare, if not non-existent.)
For example, suppose that the four letters A, C, G and T occur
equally often in the population at the chosen polyallelic SNP.
Under this simplifying assumption, for a quarter of the population
the first pair will comprise two identical letters, AA, CC, GG or
TT; the remaining three-quarters of the population will be
heterozygous.
If W is homozygous, say AA, then 7 of the 16 possible values of
Z's ordered pair will match W (AA, AC, AG, AT, CA, GA, TA).
If W is heterozygous, say AC, then 12 of the 16 possible values
of Z's ordered pair will match W (all except GT, TG, GG and TT).
So the probability of finding a match in this sense for this
example is 0.25*(7/16)+0.75*(12/16)=43/64=0.671875 or 67.1875%,
much lower than for a biallelic SNP, whatever the distribution of
the two letters in the popluation at the biallelic SNP.
In practice, we know that the distribution of letters at most
SNPs is far from uniform: rather than A, C, G and T each occuring
25% of the time, at some SNPs A may occur 90% of the time, G 10%
of the time and C and T never.
If we look at 10 consecutive biallelic SNPs, what is the
probability that the two people are half-identical at all 10
locations?
If we assume that both letters are equally likely at each SNP,
then the ex ante probability that W and Z are
half-identical at 10 consecutive locations is 0.875 to the power
of 10, which is around 26.3%. For 20 consecutive biallelic SNPs,
the probability drops to roughly 6.9%. For 50 consecutive
biallelic SNPs, it is of the order of 0.1%. For 100 consecutive
SNPs, it is of the order of 10-6 and it soon becomes
vanishingly small.
If we assume, as in our other example, that the (unobservable)
ordered pairs for the two people at each SNP are independently
chosen randomly from a uniform distribution with four possible
values, then the answer is 0.671875 to the power of 10, which is
only around 1.9%, compared to around 67.2% for a single SNP. For
20 consecutive SNPs, the probability drops to roughly 0.04%. For
50 consecutive SNPs, it is of the order of 10-9. For
100 consecutive SNPs, it is of the order of 10-18 and
it becomes vanishingly small more quickly than for biallelic SNPs.
As can be seen from the table above, these probabilities decline
less quickly if one letter is more common than the other at each
SNP.
Nevertheless, it holds as a general principle that the
probability that two individuals are half-identical throughout a
long region purely by chance becomes vanishingly small as the
length in SNPs of the region increases.
Note, however, that the more SNPs in a region at which you are
homozygous and the rarer the letters you have at those homozygous
SNPs, the smaller all the probabilities are, and the less likely
you are to be half-identical to another randomly chosen individual
purely by chance on that region. These are the regions in which
you should begin your search for relatives.
The likelihood that W and Z's DNA is half-identical purely by
chance throughout a particular region decreases the more mutually
homozygous SNPs they share in the region.
While the total number of SNPs in such regions is universally
reported, I have yet to find any comparison tool which routinely
reports the far more informative total number of mutually
homozygous SNPs.
A region in which all the pairs are half-identical is known as a
half-identical region. It would be more sensible to call it
a half/half identical region, as it is a region in which half of
one individual's DNA matches half of the other individual's DNA.
The two individuals could be said to region-match in this
region.
In practice, consecutive base pairs or consecutive SNPs are not
independent, as was implicitly assumed in all of the above
probability calculations, but are inherited in chunks from both
parents. So we observe many more half-identical regions in
practice than pure chance would suggest. The longest (in mutually
homozygous SNPs) of these half-identical regions arise not by
chance, but by inheritance.
There are several possible origins of a half-identical region
when comparing W and Z:
- The region may be half-identical by omission:
- As already noted, there may be SNPs
within the region which have not been observed and where W and Z
are not half-identical at all.
- The region may be half-identical
by chance:
- Neither of W's (unobservable) segments within the region
matches either of Z's segments throughout the region. For
example, there is one subregion where W's paternal segment
matches Z's paternal segment but not Z's maternal segment, and
another subregion where W's paternal segment matches Z's
maternal segment but not Z's paternal segment. In other words,
the half-identical region is made up of a sequence of short
identical paternal segments and short identical maternal
segments. I have written in much more detail about
half-identical by chance regions here.
- The region may be half-identical by state:
- One of W's segments matches one of Z's segments throughout the
region. This could be viewed as a full/full match. In other
words, there are (at least) two identical by state segments. It
could even be the case that W's paternal segment matches W's
maternal segment, or that W and Z match each other on both the
paternal and maternal sides.
- The region may be half-identical by descent:
- As with IBS segments, it may be possible to prove, or to infer
with high probability, that half-identical by state regions are
actually half-identical by descent.
In the course of investigation, it may be possible to deduce with
high probability that there is a full/half match: that one of W's
segments is half-identical to Z's DNA in a particular region.
Typically, this deduction will be made when W and one or more of
W's known relatives (who are not doubly related to W) all exhibit
half/half matches with Z.
Once again, in general, the longer two half-identical by chance
regions, the more likely they are to be half-identical by descent
Half-identical regions which are both more than 1 cM long and
more than 500(?) SNPs long are described at familytreedna.com as
shared segments.
Logically, if two people have identical segments (a full/full
match), then they have a half-identical region.
The converse, that there are identical segments in a
half-identical region (a half/half match), does not
automatically follow.
It should be possible to do some probability calculations to
estimate the probability that a half-identical region of a given
length (in SNPs) contains an identical segment.
Ann Turner's
"Identity
Crisis" article in the Journal
of Genetic Genealogy (Volume 7, Fall, 2011) looks at several
cases where a half-identical region is made up of overlapping
segments, but it considers only the possibility of two or at most
three overlapping segments. She describes a region with several
alternating identical paternal and maternal segments as "identical
by state" or a "pseudo-segment"; a region including a long segment
from one parent in the middle, with a short segment from the other
parent at either or both ends as having "a fuzzy boundary"; and a region
comprised of one paternal segment and one similarly sized maternal
segment as a "compound segment".
A cautionary tale and data-mining
When a golfer, no matter how good, strikes a tee-shot, the
probability of a hole-in-one is miniscule.
When a golfer plays a 72-hole tournament, the probability of a
hole-in-one during the tournament is much larger.
In the course of a 72-hole tournament, the probability of a
hole-in-one by one of a field of perhaps hundreds of players is
much larger again than the probability that any individual named
player scores a hole-in-one.
Some gamblers who understood this principle made a lot of money
at the expense of bookmakers who did not.
Similar principles apply when comparing DNA.
When comparing the DNA of two individuals who have a priori
evidence suggesting a relationship, the probability that a
reasonably long half-identical region is half-identical by chance
is miniscule.
When comparing the DNA of one individual with that of all the
other individuals who have sent their DNA to a DNA company, the
probability that one or more of the half-identical regions
identified are half-identical by chance is much larger.
When comparing the DNA of one individual with that of all the
other individuals in a meta-database like GEDmatch.com containing
observations from many DNA companies, the probability that one or
more of the half-identical regions identified are half-identical
by chance is much larger again.
This can also be viewed as an example of data-mining -
the principle that if you look hard enough for a pattern in a
large database, you will eventually find one.
Statistical inference
The word test is used with many different meanings in
many different fields. To a scientist or a medic, it may be a
deterministic test with a definite positive or negative outcome.
To a statistician, it is a hypothesis test which can
accept or reject (but not prove or disprove) a hypothesis based on
the observed outcome of one or more random experiments. The word
is used loosely by genetic genealogists with other meanings, but I
will try to stick to the rigorous statistical meaning. In
particular, I prefer to refer to the companies involved in genetic
genealogy simply as DNA companies rather than "DNA testing
companies" or "DNA sequencing companies" as they are more often
described. The term "DNA sampling company", which more accurately
describes what the companies really do, is rarely used. It will
become clear from what follows what the DNA companies do, what
they don't do, what they should do, and what their customers and
organisations like ISOGG or the FDA representing the interests of
their customers should lobby them to do.
To a statistician, a sample is the set of data collected
from the random experiments on the basis of which a
hypothesis is tested. So a DNA sample comprises either the
strings of letters returned by a DNA company or the cells
collected from its customers from which those letters are
observed. The relevant random experiment is not the collection of
cells and observation of letters (which is deterministic, apart
from some measurement error) but the act of reproduction
many years earlier in which the random processes of mutation and
recombination produced the child's DNA from the parents'.
The various competing DNA companies market various products
which comprise both the collection of cells, the raw data
returned in the form of strings of letters and the interpretation
of both the genealogical and medical implications of those raw
data.
Genetic genealogy has been very poorly explained, or even
mis-explained, to the public. See, for example, Blaine Bettinger's well-reasoned post on genetic exceptionalism.
The results of DNA analysis are frequently combined with the
history and mythology of human migration. The connection between
genetics and the history of human migration is generally extremely
poorly explained. Is it based on DNA extracted from prehistoric
human remains, on other evidence from excavation of prehistoric
settlements, or on pure guesswork based on the geographical spread
of DNA in today's living people?
Analysis of DNA can provide estimates of the probability
that an individual currently living in place A and an individual
currently living in place B had a common ancestor, either at any
time, or within a specified number of generations. DNA from living
people on its own cannot provide any information as to
whether any such common ancestor lived in place A, lived in place
B or lived in some other place C, or moved between places A, B and
C.
Consider the extreme example of a family of two brothers, one of
whom continued to live in his birthplace and fathered 10 daughters
and no sons, the other of whom emigrated and fathered 10 sons.
Their shared Y-DNA (passed from father to son) disappeared in one
generation from their birthplace, but increased and multiplied in
the emigrant's destination. The present location of the Y-DNA is
therefore far away from the location where the common ancestor
lived. (The initial brothers could of course have had male line
cousins who passed on the same Y-DNA, perhaps in yet another
different location.)
The units in which DNA testing (Y-DNA testing in particular)
measures the genetic distance between two individuals are numbers
of mutations, i.e. rare (small probability) differences in DNA
between a child and the parent from whom the child inherits the
DNA. By studying the frequency distribution of mutations per
reproduction (or recombinations per reproduction for
autosomal DNA), we can begin to understand the significance of
this genetic distance. With some knowledge of the number of reproductions
per generation (i.e. the average number of children fathered
by each male) and its variation over centuries and millennia, estimates
of the average number of mutations per generation or
recombinations per generation can be derived. These can then be
used to provide further estimates of the number of
generations between the two individuals. By studying the frequency
distribution of the age of parents at reproduction (i.e. years
per generation) and its variation over centuries and
millennia, estimated numbers of years for variables like
the time to the most recent common ancestor can be derived. As
stated by Dan Bradley of Trinity College Dublin at BTOP, the error
bars for such time estimates are typically of the order of +/-50%
of the point estimate. (I presume that "error bar" is geneticists'
jargon for what statisticians' jargon calls "confidence
interval".)
Genetics is a branch of applied probability and statistics in
exactly the same way as insurance, gambling, investment, lots of
sports, medicine and many other aspects of everyday life are. The
highly educated population of the 21st century are well capable of
understanding it, provided that it is defined precisely and
explained clearly in this context. Indeed, as Kelly Wheaton says,
"a statistics course is more important than a genetics one for
genetic genealogists".
Genetic genealogy is a branch of genealogy which likewise has its
place alongside traditional genealogical methods. Statistics prove
nothing and likewise genetic genealogy alone proves nothing. Both,
however, can be of great help in telling researchers where to look
for the desired proof, and in rejecting wrong hypotheses.
Annelies van den Belt, chief executive of DC Thomson Family
History, told the Oireachtas
Joint
Committee on Environment, Culture and the Gaeltacht on 12
December 2013 that her company's DNA products are tools to allow
casual users to discover their roots without in-depth research.
This sounds like "dumbing down" rather than education. The
intended audience of this page does not include such casual users.
Genealogy is not possible without in-depth research.
Many of my doubts about aspects of what is passed off as genetic
genealogy are reinforced by the Genetic
Astrology page of the Molecular and Cultural
Evolution Lab at University
College London. Another good source is Elliot Aguilar's
article Selling
Roots.
After looking at lists of autosomal DNA matches for some time,
most people realise that some are close enough to be of
genealogical interest and others are distant enough to be a waste
of time. Somehow the vague and poorly defined terms IBD and IBS
have come to be used to describe respectively the half-identical
regions which are of genealogical interest and those which are
not. Debate rages as to where one should draw the line between the
two categories and as to what terms should be used to describe
each category.
In my case, the first new relative that I discovered through DNA
testing was a ninth cousin twice removed whom I found through
GEDmatch.com and facebook.com; he was not deemed an
FTDNA-overall-match to either myself or any of my known relatives.
The first new relative that I discovered through FamilyTreeDNA.com
was not an FTDNA-overall-match to myself, but was second to me
among my paternal first cousin's FTDNA-overall-matches, hiding
behind an e-mail address from the other side of the Atlantic, with
a longest half-identical region of 32.41cM. So I certainly wont be
dismissing anything shorter than 32.41 as "IBS".
The question one must really ask here is what length of
half-identical region suggests that someone in a DNA database is
more closely related than the average person one might pass
walking down the street? We all have millions of distant cousins.
We all share descent from anyone who lived in the same
geographical area a thousand years ago. We all have a billion
slots to fill on the 30th generation of our family tree. If two
people can document that they are 10th or 15th cousins, it is
quite likely that they are equally closely or more closely related
on other lines that they have not yet documented. At that
distance, DNA does not add anything to our knowledge of
relationships that pure mathematics has not already told us.
I was asked to look at the ADSA output
for two full-siblings and noticed a remarkable difference. On
Chromosome 6, they are half-identical (and possibly fully
identical) from location 148,878 to location 75,903,756 and from
location 165,993,090 to location 170,761,395.
Between location 34,600,991 and location 67,897,582 the brother
has only one match, namely the sister. However, the sister has no
less than 115 matching segments (including the brother) in this
region. It is probably safe to conclude that the siblings
inherited both their paternal chromosomes and their maternal
chromosomes from opposite grandparents in this region.
ADSA really makes this hidden conundrum jump out like a sore
thumb.
The lengths of these 115 matching segments range from 6,300 SNPs
to 9,100 SNPs and from 7.09cM to 9.46cM. This is clearly an area
where the SNP/cM ratio is unusually high.
Many of the sister's 115 matches in this area are not
FTDNA-overall-matches to each other, presumably because they don't
meet FTDNA's 20cM threshold for overall matches.
The term "IBS" is ambiguous and widely misused. It seems to be
used to describe both half-identical regions which are small on
the centiMorgan scale and half-identical regions which are small
on the SNP scale.
Half-identical regions which are small on the SNP scale (no
matter what their size on the centiMorgan scale) are quite likely
to be half-identical-by-chance, i.e. to be comprised of sequences
of alternating small compound segments, representing
paternal/paternal, paternal/maternal, maternal/paternal and/or
maternal/maternal matches lined up together.
Half-identical regions which are small on the centiMorgan scale
(but possibly very large on the SNP scale, as in the present
example) are most unlikely to be merely half-identical-by-chance.
However, they may come from a very distant MRCA and consequently
(as in the present case) be shared by a very large group of
descendants.
Throwing away the half-identical-by-chance regions makes perfect
sense, but throwing away the others with them is definitely a case
of throwing away the baby with the bathwater.
We know that anyone who was alive 1000 years ago and has living
descendants today must statistically be an ancestor of practically
everyone living today, at least within a defined geographical
region such as Ireland. Our example is Brian Boru, a High King of
Ireland, the millennium of whose death at the Battle of Clontarf
in 1014 was celebrated recently.
I like to think of the region on Chromosome 6 where the sister in
this example is half-identical to 115 other people as coming from
a MRCA of some time around Brian Boru's generation.
If we plotted half-identical regions on a scatter plot with the
length in SNPs on the X-axis and the length in cM on the Y-axis,
everyone would agree that those which fall near the axes are of
little genealogical value and those that fall far out to the
north-east of the diagram are of great genealogical value. The
question remains of where to draw the boundary between the
valuable ones (which a lot of people call IBD) and the others
(which a lot of people call IBS). The general convention seems to
be to draw a right-angled boundary and throw out everything below
a particular cM threshold AND everything below a particular SNP
threshold.
The quadrant northwest of the threshold point contains the
regions that are half-identical-by-chance; the quadrant southeast
of the the threshold point contains the segments from very distant
MRCAs; the quadrant southwest of the threshold point contains
regions failing on both criteria; and the quadrant northeast of
the threshold point contains the good matches.
Why don't we use a diagonal boundary rather than a right-angled
boundary? And why don't we set a different boundary for matches
where there is additional evidence of a possible close
relationship? E.g., in the present example, people who match the
reference person's full-sibling and are just outside the chosen
boundary should be considered better matches than people who don't
match the reference person's full-sibling but are just inside the
chosen boundary.
Ethnicity
The word 'ethnicity' is widely used in the marketing of DNA
products. I have not even attempted to research how this word is
defined. While the word is not used in Mark
Thomas's
Guardian article, I suspect that it is one of the
concepts which he says 'are better thought of as genetic
astrology'.
Nevertheless, the estimated ethnicity percentages derived from
DNA and peddled by many DNA companies seem to be a key selling
point, prompting many people with no interest in genealogy to end
up on the DNA comparison websites.
FamilyTreeDNA's concepts of ethnicity long relegated all those of
Irish ancestry to "British Isles" ethnicity, which many Irish
people consider at best objectionable and at worst plain wrong.
This finally changed with the release of myOrigins 3.0 starting on 22
September 2020.
All
estimated ethnicity percentages that I have seen are displayed
without any estimated margin of error. Until I can see solid
statistical evidence that they are significantly different
from zero, I will work on the assumption that all small
percentages are essentially zero.
Large
estimated ethnicity percentages are sometimes useful
geographical clues in unknown parentage searches. An
estimated percentage of over 25 is probably worth
investigating.
There
are many good articles on the mis-selling of estimated
ethnicity percentages, such as this one by John
Grenham in 2016 and this one in WIRED magazine
in 2020.
Some DNA companies (ancestry.com in particular)
have employed marketing people to sell their products by promising
not to use jargon. In other words, they admit that they want to
sell only to people who don't know what they are buying. Consumer
protection authorities should look into this: the better regulated
financial sector would never be allowed to get away with it! See Roberta Estes's blog and Heather
Collins's
blog for further critique
of
the ancestry.com product.
Any new science requires a new vocabulary to explain it. However,
an attempt to reconcile the geneticists' vocabulary, the
genealogists' vocabulary and the statisticians' vocabulary is
urgently required. Scientists and marketers should agree on the
vocabulary, minimise the number of different synonyms used for
each concept, avoid mentioning concepts which are not directly
relevant to their audience, and define any new words which are
necessary clearly and precisely, with whatever diagrams and
mathematical models are necessary to help the understanding of
those who prefer verbal, spatial or quantitative approaches
respectively. The problem is epitomised both by the looseness of
FTDNA's glossary
and by AncestryDNA's refusal to even use what it terms "jargon" to
make its statements intelligible to multiple audiences.
For example, as noted above, at
FamilyTreeDNA.com, the simple words "block" and "segment" appear
to mean exactly the same thing and to be used interchangeably on
the same page, unnecessarily confusing the company's customers.
(If there is a subtle difference that I have missed, please let me
know.)
As genetics is a branch of applied probability and statistics, it
cannot be explained clearly without using the basic vocabulary of
those subjects, i.e. words and phrases like probability, estimate,
confidence interval and hypothesis test. Beware of anyone who
tries to persuade you otherwise.
Like any sophisticated and rapidly developing website,
FamilyTreeDNA.com is bound to take some getting used to.
It appears that every visit has to start with a login
screen even if one ticks the apparently useless 'Remember
me' checkbox. One must also remember to click the small dark "LOG
IN" button towards the middle left, not the larger and brighter
"Login" button or plain text "Login" at the top right, which
merely reloads the login screen. There are regular annoying
pop-ups saying things like: 'You have been idle for 120 minutes.
Your session may have timed out. The page will be reloaded and you
may need to log in again.' or 'Your session will expire on Sun Nov
17 2013 13:19:52 GMT+0000 (GMT Standard Time). You have 5 minutes
remaining until your session times out. Click OK to keep this
session.' If facebook.com can keep its billions of users
permanently logged in, there is no excuse for any smaller website
such as FamilyTreeDNA.com not to provide this option. At least the
timeout was increased from 30 minutes to 120 minutes soon after I
started to use the website.
Those managing DNA samples from multiple family members must
become project administrators in order to use a single login for
all the kits. Even then, up to 2016 there was no way to use the
known relationships between the kits of family members in more
appropriately targeted searching for matches.
If you are a project administrator and wish to scan multiple kits
simultaneously for new matches, then I recommend the following
strategy:
- Open a new browser window and go to the Kit Authorization page, which may involve
diverting first to the GAP 2.0 Sign In page, where you can log in
with your project administrator username and password.
- For each of your kits, in the order in which you would like
them to permanently appear, enter the kit number and passwords
in the respective fields and click the Submit button.
- This produces a table of kit numbers (hyperlinked to open the
kit home page in a new tab), names and delete buttons;
right-click each kit number in turn and select Open Link in New
Tab to open each of these simultaneously in separate tabs.
- For each of the tabs that you have opened, under Family
Finder, select Matches, then select Match Date to sort by most
recent match first.
- If you shut down your computer with the first (Kit
Authorization) tab in this window active, and then when you
re-start your browser session you log in again with your project
administrator username and password, and reload all tabs in
this window, you will see the most recent Family Finder matches
for all of your kits by Ctrl-<tab>bing through these tabs,
without having to log in or log out of each individual kit.
- In some versions of some browsers, you will still have to sort
by most recent match first and click the "Show Full View" link
for each kit for each session.
A similar strategy should work for Y-DNA and mtDNA.
On the topic of the tools provided to project administrators, an
example of their further shortcomings is the Family Finder Illumina OmniExpress Matrix.
This is just about the most useless tool I can imagine:
- For those deemed FTDNA-overall-matches, it implies spurious
accuracy by giving the Total cM to five decimal places (seven,
if one remembers that centiMorgans are already
percentages). Then it pads out the results with another
five zeroes.
- For those not deemed FTDNA-overall matches, it round
everything below 19.9999900000 down to 0.0000000000!!
- There is an unqualified "Relationship (Generations)" option,
based on the Suggested Relationship column of the results
spreadsheet, but there is no "Known relationship" option on the
dropdown menu!
Later chapters will deal with the separate interfaces at
FamilyTreeDNA.com for investigating results concerning the different
types of DNA.
I have already mentioned GEDmatch.comin
passing
a few times, and noted that my own GEDmatch.com kit can still be
found using the original kit number F310654. However, I now appear
in other people's match lists as T205074 (based on a FamilyTreeDNA
data file) and A931453 (based on an AncestryDNA data file). There
are only minor differences between these files as the samples were
submitted when the two companies were using essentially the same
set of SNPs. More recently, they have used very different sets of
SNPs and the same person's data files from samples submitted more
recently will give very different results at GEDmatch.
As with all DNA comparison websites, paranoia leads to some
potential users expressing reservations from what some describe as
a "security" point of view. Personally, I am far more comfortable
with GEDmatch.com having my DNA data than I am with AncestryDNA
having it! The people running GEDmatch.com clearly want to
help me to find my relatives; the people running AncestryDNA
clearly are solely interested in separating me from my money.
As of 6 February 2015, my 664 FTDNA-overall-matches yield 622
distinct e-mail addresses and my top-1500 GEDmatch one-to-many
matches yielded 1144 distinct e-mail addresses. The overlap was
only 96 e-mail addresses, or just over 15% of the researchers that
I could contact via FTDNA. On the one hand, that means that
GEDmatch.com allows me to contact 1048 researchers who either are
not customers of FTDNA at all or are customers of FTDNA but don't
meet the thresholds required to be deemed FTDNA-overall-matches to
me. Of my GEDmatch list, 614 came from ancestry.com, 449 directly
from FTDNA, 45 from other sources via FTDNA, 391 from 23AndMe, and
one was a phased kit. My conclusion is that, despite the great
promise of GEDmatch, sending DNA samples to the other two
companies will vastly increase the size of the pool in which I can
fish for possible relatives.
One huge disadvantage of GEDmatch.com is that it doesn't operate
according to the basic principles underlying the vast majority of
websites, such as recognising logins for a fixed time or
permitting hyperlinking and bookmarking of individual web pages
within the website.
For example, if you go to http://www.gedmatch.com/
in one browser tab and login, and immediately open a new tab and
go to the same URL, you will again be presented with the login
screen. If you wish to look at several GEDmatch.com reports at the
same time, then login and open the main menu in one browser tab.
Every time you want to look at a new report, go back to that tab,
right-click on the link to the form for whichever report you want
next, and select Open Link in New Tab or equivalent.
A consequence of this bizarre policy is that the instructions that I
have put together for getting your DNA data and your pedigree chart to GEDmatch are extremely
clunky and not the simple "click here" style instructions that I
would love to provide.
FGEDmatch is brilliant and it really is worth getting your head
around the totally irrational user interface.
Getting your DNA data from FTDNA
to GEDmatch
During 2016, a number of changes took place in how FTDNA results are
uploaded to and displayed at GEDmatch. Up to 11 April 2016, the
GEDmatch kit number was the FTDNA kit number preceded by the letter
F, so that my FTDNA kit, 310654, became F310654. These kit numbers
still work for kits uploaded to GEDmatch before that date. After
that date, the FTDNA upload procedure changed and the GEDmatch kit
number became a random six-digit number preceded by the letter T, so
that my kit is now also T205074. A new easy DNA upload procedure for
all supported autosomal testing companies was introduced around the
start of September 2016, which generated kit numbers comprising a
random six-digit number preceded by the letter Z. For kits uploaded
using this procedure, it is no longer obvious which company the data
originated from. More recently, the common upload procedure for all
companies has been improved to again identify the source of the data
and prefix the random six-digit number with the appropriate letter
(A for AncestryDNA, H for MyHeritage, M for 23andMe, T for
FamilyTreeDNA).
For my detailed instructions, see here.
Getting your DNA data from
AncestryDNA to GEDmatch
For my detailed instructions, see here.
Getting
your GEDCOM file to GEDmatch and linking DNA kits to individuals
in the GEDCOM
As with any DNA comparison website, in order to be of maximum
assistance to DNA matches, all DNA kits at GEDmatch.com must be
associated with GEDCOM files giving the known direct ancestors of
the DNA subject.
Full details of how to do this are here.
My GEDmatch.com kit number
If you think that you may be related to me, then you will also
want to compare your GEDmatch kit with those of my other close
known relatives, which you will find at the top of the one-to-many
match list for my own combined kit VA864386C1.
It is possible to download raw data from FamilyTreeDNA.com,
ancestry.com, MyHeritage.com, 23andMe.com and some other websites
and upload it to GEDmatch.com, which provides alternative and
generally superior tools for analysis of the DNA data.
Another huge advantage of GEDmatch.com is that it has long allowed
comparison of X chromosome data, which, after several missed
deadlines, was introduced in a limited way on the FamilyTreeDNA
website itself on 2 January 2014. GEDmatch.com shows that one may
not share any detectable autosomal DNA with those with whom one
shares the most (in cM) X-DNA. FamilyTreeDNA.com permits X-DNA
comparisons only between those who also share autosomal DNA.
Another huge disadvantage of GEDmatch.com is that it is was long
run by part-time amateurs and funded by voluntary donations, so
that there has been a constant struggle to match the facilities
offered to the demand for those facilities. Service improved since
the months around February 2015, when the following message was
displayed on the login page:
Due to increased usage we are experiencing slow or non
response for GEDmatch programs.
We apologize and suggest logging on during off hours if you
experience slow response.
GEDmatch.com was taken over by Verogen in late 2019.
After login, you can click through to the 'One-to-many' matches
form at http://ww2.gedmatch.com:8006/autosomal/r-list1.php.
However, if you follow that link directly, then you will probably
just see a message saying: "ERROR(49) Not Logged in". What should be
achievable in one point-and-click operation requires three
point-and-click operations. By filling in the form, I can go to http://ww2.gedmatch.com:8006/autosomal/r-list2.php?kit_num=F310654&cm_limit=7&x_cm_limit=7&xsubmit=Display+Results
where I see a long table of 3000 DNA matches to my Kit (originally
the one-to-many list showed only the top 1500 matches and later only
the top 2000 matches). However, if you follow that link directly,
then you will probably again just see the "ERROR(49) Not Logged in"
message. This error message appears whether or not you navigate to
the page in a tab in which you are currently logged in.
The 'Gen' column by which GEDmatch.com sorts one-to-many matches
by default is confusing. If a parent and child are both in the
database, then GEDmatch.com finds that they are half-identical
everywhere, and estimates 'Gen' as 1. However, if an individual
submits samples to two DNA companies and uploads the data from
both companies, then GEDmatch.com finds that the two kits are
half-identical everywhere, and again estimates 'Gen' as 1. The
matching algorithm fails to check for full matches everywhere,
which would distinguish the parent-child relationship from the
duplicate (or identical twin) relationship. If it did so, then it
would presumably set 'Gen' to 0 for the latter comparison.
Similarly, you can click through to 'One-to-one' compare
form at http://ww2.gedmatch.com:8006/autosomal/u_compare1.php
and fill in the form to go to http://ww2.gedmatch.com:8006/autosomal/u_compare2.fnx?kit1=F310654&kit2=FU2924&chart=0&resolution=1000&threshold=&shared=&noise=&win_size=&bunch_limit=&xsubmit=Submit,
but if you follow that link directly, you will get a different
error message: (500) Internal Server Error. At least it is
accompanied by a statement of the bizarre GEDmatch policy:
One common cause is trying to link to this page from a forum or
an email. Most GEDmatch pages do not allow this, and require
that you log-in to the site directly. Other than the main page,
pages on this site should not be accessed from your browser
history, or from links posted in forums, Google, etc.
The 'one-to-one' results show "Estimated number of generations to
MRCA"; however, the algorithm used to arrive at this
estimate depens on the parameters selected when submitting
the form, so I have chosen to ignore all "Gen" figures generated
by GEDmatch. I find the centiMorgan estimates much easier
to get my head around than the Gen estimates, which, as
already noted, don't seem to distinguish at the most basic
level between self/identical-twin matches (Gen=1.0) and
parent/child matches (also Gen=1.0). Attempting to distinguish
between Gen=4.8 and Gen=4.9 can only convey a false and
spurious sense of accuracy about estimates which have huge
margins of error associated with them.
For example, Comparing Kit A475217 and A370395 with the
default settings as of 3 Nov 2018 (Minimum threshold size to be
included in total = 500 SNPs; Minimum segment cM to be included in
total = 7.0 cM) produces an estimate of 3.5 Gen; changing to
Minimum threshold size to be included in total = 400 SNPs and
Minimum segment cM to be included in total = 6.0 cM produces no
estimate. Thresholds of 1000 SNPs and 10cM give a more distant
relationship estimate of 3.7 Gen. The default settings for the
one-to-many comparison appear to produce the same estimates as the
default settings for the one-to-one comparison.
As of 27 January 2014, the Find people who match with you on
a specified segment page at http://ww2.gedmatch.com:8006/autosomal/seg_compare1.php
behaved more normally. Following that link often produced
ERROR(49) Not Logged in. Filling in the form brought one to http://ww2.gedmatch.com:8006/autosomal/seg_compare2.fnx?kit1=F310654&chrom=X&start=23955089&end=36111764&shared=7&chart=0&resolution=1000&xsubmit=Submit
but if you follow that link directly, you will again be redirected
to the error message: (500) Internal Server Error. The
GEDmatch.Com Chromosome Segment Comparison took a very long time
to complete (this one reported: "Comparison took 2714.723849
seconds"), so one had to make sure to start it at a time when one
would not need to shut down one's computer shortly! Because of the
load it was imposing on the GEDmatch servers, this analysis tool
was withdrawn around February 2014.
On most of the GEDmatch.com forms, if you navigate back to the
form using the browser back button or Ctrl-LeftArrow, the last
values that you filled in will often be wiped out and you need to
start from scratch. This behavious is not consistent: I have
managed to open the same form in two tabs in the same window, and
found that in one tab I could repeatedly navigate back and find
the values still filled in, while in the other tab no matter how
often I navigated back the values were wiped out. The usual
workaround for that is to edit the URL in the navigation toolbar
of your browser, but that is also disabled at GEDmatch.com!
Finally, if you close and re-open your browser with GEDmatch.com
output visible in several open tabs, you will find the above error
messages in each tab and have to re-enter the data in every form.
On 24 Mar 2014, I posted the following query in the GEDmatch Forums/DNA
Utilities/Triangulation:
Subject: How can I find people who match two kits on a segment
where those two match each other?
I have some known relatives who have uploaded their data to
GEDmatch, such as my fifth cousin Cindy.
Our longest half-identical region is 4.6cM and our Estimated
number of generations to MRCA = 6.9. Hence we don't appear on
each other's top 1500 'One-to-many' matches even if we set
minimum Autosomal largest segment to 4.5cM. Both of our top 1500
lists stop at 6.5 generations to MRCA.
There are 64 kits in common between my top 1500 and Cindy's top
1500.
The next thing I would like to do is to go through these 64
kits and find the people who match both of us and also each
other on the same regions. Any such people are the most likely
to be descended from our common GGGGgrandparents.
It seems that there should be a form where I can enter my kit
number and my fifth cousin's kit number and get a list of the 64
kits who are common to our top 1500 along with some indication
of which ones are half-identical to either or both of us on the
regions where we are half-identical to each other.
The current Triangulation and Segment Triangulation utilities
each ask for a single kit number, and look for pairs of kits
which match the selected kit and match each other.
I would prefer a triangulation utility which asks for two kit
numbers (obviously of known relatives who match each other) and
looks for other kits which match both selected kits on the same
regions where they match each other.
How can I do this without using Excel to find the 64 common
matches between the two top-1500 lists and then manually doing
128 'One-to-one' compares between each of the 64 with me and my
known relative?
The 'People who match one or both of 2 kits' utility does not
appear to check whether the matches are in the same regions
(suggesting a single common ancestor for all three) or in
different regions (allowing the possibility that the third
person is connected to the first two through different common
ancestors).
The Tier 1 Matching Segment Search now provides the solution to the
problem outlined in the above query.
GEDmatch.com continually tweaks its matching algorithm. On 29 Sep
2014, I looked at the top-1500 cut-off point in Gen for 11 kits
and found the following range of values:
F303343 Donna: 6.6
F318138 Cindy: 6.8
FU2924 Anthea: 6.8
F310654 Paddy: 6.9
F335377 Antoin: 7.4
F325507 Colm: 7.4
F325763 Dara: 7.4
M090954 Sean: 7.4
M081357 Joanne: 7.5
F325501 Aileen: 7.5
F335391 Mary: 7.5
Anthea appears on Joanne's top-1500 at 6.9 Gen, but Joanne
doesn't make Anthea's top-1500 which stops at 6.8 Gen.
The chapters which follow on interpreting the different types of
DNA results will all eventually contain reviews and what I hope
will be some constructive criticism of the relevant parts of the
FamilyTreeDNA.com and GEDmatch.com websites.
The dna.ancestry.com website
I spat for AncestryDNA myself around October 2015 after a number of
other people had given me access to their dna.ancestry.com match
lists.
You may be shocked to discover that the one-off fee for DNA analysis
gives ancestry.com's customers access to a list of the usernames of
matches, but that it is necessary to pay an additional annual fee to
see the pedigree charts which a small proportion of these matches
have added to their DNA results. No royalties are paid to those who
compile the family trees which ancestry.com then sells on to its
other customers. No basic error-checking is carried out on these
trees before they are re-sold, for example, to confirm that children
are conceived or born while their supposed parents are alive. New
subscribers are encouraged to just make a guess if they don't know
the relevant information about their ancestors and relatives, and
these guesses are re-sold as "hints", in exactly the same way as
well-researched and well-documented trees are.
I once wrote here that the proportion of ancestry.com's DNA
customers with pedigree charts and the ease with which those
pedigree charts can be viewed by annual subscribers are both vastly
superior to any of the other genetic genealogy websites. However,
the rapid growth in the AncestryDNA customer base has far exceeded
the growth in the number of customers linking their DNA sample to a
pedigree chart.
Standard ancestry.com user profile pages, for example that of Bobt55, do not allow the user to easily reveal
(e.g. by ticking a box), if he or she wishes to do so, whether or
not he or she has sent a DNA sample to ancestry.com.
One would imagine that some of the ancestry.com marketing people
would realise that one great way of enticing new people into the DNA
database is to let them know that their known or suspected relatives
whose family trees they have found at ancestry.com are already in
the database before them. It seems that the division of labour
within ancestry.com is such that the marketing people, website
designers and legal advisers know next to nothing about genetic
genealogy and are oblivious to the critical importance of the number
of samples with attached pedigree charts in the database, in
particular the number of such samples from a potential customer's
known relatives, in making it of any genealogical value. The
internal privacy police seem to have more clout than any of the
other staff.
The AncestryDNA Insights page encourages the viewer to look at the
eight most recent matches with profile photographs, not the most
recent matches with linked pedigree charts. So you must add a
profile photograph to your kit before your results arrive, following
these instructions. Clicking the pink
or blue circle beside your name as instructed has no effect if
your test was activated using someone else's account. Hence, my
AncestryDNA kit has no profile photograph.
At the Rootstech event at the end of February 2019, ancestry.com
launched an improved user interface, which made it much easier to
manage one's match list.
AncestryDNA custom
groups
I recommend using the custom groups feature introduced in February
2019 to record through which parent, grandparent, greatgrandparent
or greatgreatgrandparent(s) you are most likely to be related to
each of your matches.
At the top of your match list, there are seven drop-down menus, initially
headed "Unviewed", "Common Ancestors","Messaged","Notes", "Trees",
"SharedDNA" and "Groups", and also "Search" and "Sort" links.
Clicking on "Groups" opens a drop-down menu which allows you to
"Create custom group" (provided that you have not already created
the maximum permitted number of 24 such custom groups).
Your match list (and the match list of anyone else
who has made you a collaborator, as opposed to a viewer) also has an
"Add to group" link for each match, which changes to an "Add/edit
groups" link once the match has been added to one or more custom
groups. Clicking on this link opens a dropdown menu which also
allows you to "Create custom group" (and automatically add the
current match to the newly created group) and/or to add the current
match to a built-in group called "Starred matches".
You can create up to a maximum of 24 custom groups in addition to
the Starred matches group, and you can add each of your matches to
zero or more of these 25 custom groups.
The "Groups" drop-down does not allow you to edit existing custom
groups, but the "Add to group" drop-downs have a pencil icon beside
each custom group name which allows you to edit the name and colour.
You have to reload the whole page before your edits take effect. If
you select a group from the "Groups" drop-down, then an "Edit group"
button appears away over near the top right of the screen, which can
also be used to edit the name and colour.
There are two philosophies for associating matches with ancestors:
- Some people like to associate each match with the most recent
common ancestral couple
shared with the match.
- Other people like to associate each match with the most
distant individual
ancestor related to the match.
Typically, the ancestral couple in the first philosophy are the
parents of the individual in the second philosophy.
The first philosophy leads to complications when you have an
ancestor who had two families (like my greatgrandfather Old Johnnie
McNamara). I think this is why I prefer the second philosophy.
Most matches can be assigned to either the paternal or maternal
side. The main exceptions are full siblings, nieces, nephews,
children, etc., who are related to both parents, i.e. doubly
related. There are other exceptions if your parents are related.
Uncles, aunts and first cousins (and their more distant descendants)
can be assigned to one parent; second cousins etc. can be assigned
to one grandparent; third cousins can be assigned to one
greatgrandparent; and so on.
In an ideal world, one would have one group for doubly related
individuals, two groups for paternal and maternal relatives, four
groups for matches related through the four grandparents, and so on.
However, AncestryDNA allows only 24 custom groups, so choices have
to be made.
As I know at least the first name of all 16 of my
greatgreatgrandparents, I created one custom group for each of my 8
greatgrandparents and one custom group for each of my 16
greatgreatgrandparents, which adds up neatly to the 24 custom groups
available. I would like to also have custom groups for my two
parents and my four grandparents, but this would exceed the maximum
available number of 24 custom groups. The custom groups appear in
alphabetical (or alphanumeric) order on the dropdown menu. I decided
that I would like the custom groups to appear in the same order as
the ancestors appear in my pedigree chart, so I prefixed the name of
each ancestor with his or her Ahnentafel number from my pedigree
chart (including a leading zero for Ahnentafel numbers below 10).
This also avoids confusion between, for example, the two Thomas
Waldrons and three Thomas Durkans among these 24 ancestors. The
corresponding coloured dots seem to appear in the order in which the
custom groups were created, newest first, so you should create the
groups starting with the largest Ahnentafel number first.
The custom group names are forced into a narrow column, so keep the
names short to avoid names wrapping onto a second line, requiring
additional unnecessary scrolling up and down the list. In practice,
this will probably just mean omitting the middle names of your
ancestors.
If you have a repeated ancestor, this becomes slightly more
complicated. In one such situation, I created a group called "12
Stephen Reid/19 Kate Reid" for matches known or predicted to be
related through the siblings Stephen Reid (a maternal ancestor) or
Kate Reid (a paternal ancestor).
If you don't know many of your greatgreatgrandparents, then you can
instead create one custom group for each of your 2 parents, one
custom group for each of your 4 grandparents and one custom
group for each of your 8 greatgrandparents.
I use the notes field to substitute for the missing parent and
grandparent groups. The disadvantages of this include the fact that
it is not possible to filter on notes as it is on groups, and the
fact that notes for a match can be entered only from the page
showing your match to the individual, while matches can be added to
groups either from your own match list or from a list of shared
matches.
My pet hate in user interfaces is nested scrollbars, but others
apparently love them, and you will have to put up with them if you
create more than about 17 custom groups.
Here is what my dropdown menu looks like:

(Ancestors 09 and 12 were missing when I took the above screenshot
as I have not yet found any living descendants of their siblings.)
The tickbox before each group name allows you to easily add the
current match to the group, or remove the current match from the
group. Each custom group is assigned a coloured dot and each
match in your match list will then have a row of zero or more
coloured dots to indicate to which custom groups he or she belongs.
I will now outline the procedure which I use to assign the matches
of an AncestryDNA kit to custom groups. This procedure is
time-consuming and may take up to a couple of days for a kit with
lots of known relatives among its matches. However, it is well worth
the effort, as afterwards it becomes much easier to see how each
match is most likely to be related to the DNA subject. Furthermore,
as you go through the process, you will notice patterns, look at
unlinked trees that you might not previously have noticed, and
probably identify known relatives that you had previously missed.
A clever programmer might be able to automate the procedure outlined
below. Whether AncestryDNA would allow such automation is another
matter, as it has previous
history of objecting to such innovative uses of its website.
I recommend that you begin by marking all the known relatives
amongst your DNA matches with a star (i.e. add them to the built-in
Starred matches group). Before you do this, you might also want to
check all your "Common ancestor" hints. You will probably find that
some of these hints are clearly correct, while your reaction to many
others may range from considering them to be plausible to
dubious to spurious to plain incorrect to complete nonsense. At this
stage, you can reserve judgement on
any hint the truth of which is not immediately obvious.
When I did this first, I considered my "known relatives" to be only
those whom I had been able to add to my family tree. I
subsequently went back and added two more matches who were unknown
relatives until they appeared on my match list. Neither has been
keen to correspond and I don't know their recent ancestry, but one
shares 1,553 centimorgans shared across 65 DNA segments with my
third cousin once removed and the other shares 1,314 centimorgans
shared across 50 DNA segments with my second cousin, so I have no
doubt as to which of my ancestors they descend from.
As I find individuals from my genealogy database at AncestryDNA, I
add an "!ANCESTRYDNA:" tag to their notes in Ancestral Quest,
followed by the kit identifier (e.g.
D0F65C2D-194D-4EE6-B174-63B2B6B43E07 for my own kit). When I want to
create custom groups for a new AncestryDNA kit, I can then use
Ancestral Quest to print a list of all the known relatives that the
new kit might match. I then use a Microsoft Excel macro to generate
a list of the URLs for the possible match pages. This is a huge help
for individuals with a very complete family tree, but the process
can be done manually if your family tree is less complete.
When you have starred all your known relatives, select "Starred
matches" from the "Groups" drop-down (and click the Apply button).
The idea is to begin by indicating the most distant known ancestor
through whom you are related to your more distant starred matches.
For each starred match:
- click the Add to group link
- if you have custom groups for parents, grandparents and
greatgrandparents, tick the box for each greatgrandparent from
whom the starred match is descended, or to whom the starred
match is related, if he or she is not descended from any of
your greatgrandparents; or
- if you have custom groups for greatgrandparents and
greatgreatgrandparents, tick the box for each
greatgreatgrandparent from whom the starred match is descended,
or to whom the starred match is related, if he or she is not
descended from any of your greatgreatgrandparents.
At the end of this process:
- if you have custom groups for greatgrandparents and
greatgreatgrandparents, then
- descendants of your parents (siblings, etc.) will each have
16 coloured dots;
- other descendants of your grandparents (first cousins, etc.)
will each have 8 coloured dots;
- other descendants of your greatgrandparents (second cousins,
etc.) will each have 4 coloured dots;
- other descendants of your GGgrandparents (third cousins,
etc.) will each have 2 coloured dots; and
- other descendants of your GGGgrandparents (fourth cousins,
etc.) and more distant relatives will each have 1 coloured
dot;
- if you have custom groups for parents, grandparents and
greatgrandparents, then
- descendants of your parents (siblings, etc.) will each have
8 coloured dots;
- other descendants of your grandparents (first cousins, etc.)
will each have 4 coloured dots;
- other descendants of your greatgrandparents (second cousins,
etc.) will each have 2 coloured dots; and
- other descendants of your GGgrandparents (third cousins,
etc.) and more distant relatives will each have 1 coloured
dot; and
- individuals who are doubly related to you may have odd
numbers of coloured dots.
If you share a match with a starred match who has just one coloured
dot, then it is extremely likely that that shared match is related
to you through the ancestor corresponding to the coloured dot.
If you share a match with a starred match who has just two coloured
dots, typically a husband and wife ancestral couple, then it is
extremely likely that that shared match is related to you through
one member of that ancestral couple.
Now, on the Groups dropdown, select Starred matches, select your
first greatgrandparent (Ahnentafel number 08) or
greatgreatgrandparent (Ahnentaful number 16) as appropriate, and
select the green Apply button.
So now:
- for each starred match with just one coloured dot:
- note the ancestor corresponding to the single coloured dot
- right-click on the match name and Open Link in New Tab, and
switch to that tab
- click the "Shared Matches" tab
- for any shared match who is not a known relative and not
already in the group corresponding to the ancestor noted above,
add the match to the group
- close the shared matches tab
Repeat this procedure for each greatgrandparent or
greatgreatgrandparent as appropriate.
Then repeat the whole procedure for each pair of greatgrandparents
or pair of greatgreatgrandparents as appropriate, but this time
- for each starred match with two coloured dots:
- note the ancestor whose parents correspond to the two coloured
dots
- right-click on the match name and Open Link in New Tab, and
switch to that tab
- click the "Shared Matches" tab
- for any shared match who is not a known relative and not
already in the group corresponding to the ancestor noted above,
or in either or both of the groups corresponding to that
ancestor's parents, add the match to the first-mentioned group
- close the shared matches tab
If you share a match with a starred match who has more than two
coloured dots, things are more complicated. In my case, using a
coloured dot for each greatgrandparent and greatgreatgrandparent, a
match with four coloured dots is typically related to me through one
grandparent and a match with eight coloured dots is typically
related to me through one parent. As I have no custom groups for my
parents and grandparents, I add the relevant parent or grandparent
in the notes field as follows:
- for each starred match with more than two coloured dots:
- note the most distant single ancestor (parent or grandparent)
through whom you are related to the match
- right-click on the match name and Open Link in New Tab, and
switch to that tab
- click the "Shared Matches" link
- for any shared match who is not already in a group
corresponding to an ancestor of the relevant parent or
grandparent, add a note identifying the relevant parent or
grandparent
- close the shared matches tab
You will probably find that some of your matches (besides your
starred matches) end up with multiple coloured dots. There are a
number of possible explanations for this:
- if a match has two coloured dots corresponding to two of your
ancestors who were married to each other, and shares sufficient
centiMorgans with you, then the match may be a descendant of
that ancestral couple;
- if a match has two coloured dots corresponding to two
unrelated ancestors, then the match may be related to one of
your known relatives, but through a common ancestor different
from the common ancestor that you share with the known relative;
or
- the match with two coloured dots may be doubly related to you.
You should probably add a note to any match with multiple coloured
dots indicating the two (or more) known relatives on different sides
of your own ancestry with whom you share the match. To research and
add the note:
- right-click on the shared match's name and Open Link in New
Tab;
- click the Shared Matches tab;
- click the Groups dropdown;
- click Starred matches and click Apply;
- note from which sides of your ancestry the shared starred
matches come; and
- click the "Add note" link near the top of the new tab and add
a note explanining the potentially ambiguous shared matches.
This note will then appear under the list of coloured dots for the
shared match.
Now when you go back to All matches, matches with no dots will stand
out as probably being related through an ancestor who has no known
relatives amongst your matches. This is particularly helpful to
researchers who have an unknown parent or unknown grandparent
(etc.).
You can now revisit the "Common ancestor" hints on which you earlier reserved judgement. The
additional evidence of the coloured dot predictions may sway your
opinion as to which are correct and which are plausible, dubious,
spurious or plain incorrect or nonsense.
Using the
AncestryDNA search button
The search button at the top of an AncestryDNA match list has many
unexpected quirks.
For example, an adoptee sent me an invitation to be a viewer of his
AncestryDNA results, in the hope that I could trace his relationship
to one of his closest matches, who has two grandparents born in
County Clare, where I have many relatives.
AncestryDNA allows me to search a match list by "Birth location in
matches' trees".
The adoptee's top match with a linked tree has a GGgrandfather born
in "Rahara, Roscommon County, Ireland". Rahara is both a
parish in County Roscommon and a townland within that parish.
Pasting this location into the birth location box turns the Search
button green and produces countless search results, some with no
birth location more specific than "Roscommon, Ireland". There
is no option to insist on exact matching.
However, starting to type the location into the birth location box
produces a "No matches found" error message after the first three
letters R-A-H-, even though there clearly is a match. Typing
R-O-S- into the box produces a dropdown menu of ten places around
the world beginning with Ros-, not including Roscommon. Adding
a C to the search string changes the ten places in the dropdown
menu, which now includes "Roscommon, Ireland".
So the birth locations for which one can search appears to include
the 32 counties of Ireland, but not the parishes or townlands within
those counties (or, in some cases, straddling county boundaries).
However, if I go to the DNA Story for the adoptee, I see that his
Ethnicity Estimate includes locations much more specific than a
county, including in this case "East Limerick & East Clare",
with three "Featured Matches" "who also belong to this
community". One would hope that the matches who also belong to
this "community" have the "community" as a birth location in their
trees. However, pasting "East Limerick & East Clare" into
the birth location search box leaves the Search button greyed out. I
have yet to discover the trick to filtering the match list by the
communities in the associated DNA Story.
The DNAGedcom.com
website
This is another independent DNA tools website, featuring the Autosomal
DNA Segment Analyzer amongst other tools.
You can register here.
Then bookmark the login page. There is a "Keep me logged in"
tickbox, but it seems unreliable.
While you transfer of your raw
DNA data from FTDNA, AncestryDNA or 23andMe to
GEDmatch.com is a one-off procedure, you will want to periodically
transfer your match data
from FamilyTreeDNA.com to DNAGedcom.com as new matches appear.
As with GEDmatch.com, you can manage multiple DNA kits within a
single DNAGedcom.com account.
You will also need to bookmark the download page.
Note that your web browser may
automatically prompt you to use your DNAGedcom.com password as the
password for each new FTDNA kit from which you wish to download
match data. Remember to type the appropriate password for the
relevant FTDNA Kit Number over the suggested password before
hitting the "Get Data" button. Your web browser should then
remember the relevant passwords whenever you want to refresh
the match data for existing FTDNA kits.
If your download fails, the error message (in red on black) may
not be easy to read or scroll through. You can copy and paste the
entire error message to a text editor where it will be easier to
read, if not easier to understand.
FTDNA frequently changes its website without warning, which often
knocks out the DNAGedcom.com download procedure.
If you have an autosomal transfer kit at FTDNA, you can download
your match data to DNAGedcom.com without paying the USD19 fee to
unlock the chromosome browser etc.
There is a DNAGedcom User Group on Facebook which you
should also join.
I will return to the Autosomal
DNA Segment Analyzer later.
Interpreting autosomal DNA results
What is a match?
There are four different levels at which one can compare
autosomal DNA and look for matches or potential relatives:
- Lists of names
- A black box algorithm can be used to list the names or
pseudonyms of those in a database whose autosomal DNA is closest
to yours. The various DNA companies and third party sites each
have their own different algorithms. As
well as looking at the names of the people whose DNA has been
compared with yours, you can look at their ancestral surnames,
ancestral placenames and family trees, if they have made these
available. Anybody can do this.
- Lengths of half-identical regions
- To get full value from one's investment in DNA analysis, one
should move on from the purely qualitative approach of looking
at names and take a more quantitative approach. The first step
is to look at the percentages of the length of the genome on
which one is half-identical with a potential relative. The
higher this percentage, the closer the relationship is likely to
be. Some basic arithmetic skills are required for this.
- Locations of half-identical regions
- If three or more people are all half-identical to the others
on the same region, and if two or more of them are known
relatives, then it becomes far more likely that they are all
descended from a common ancestral couple. Furthermore, it can be
inferred that the DNA in the half-identical region has been
inherited from either the male or the female of that common
ancestral couple. This leads on to the science (or art) of chromosome
mapping, whereby one can assign various regions of the
paternal autosomes and various regions of the maternal autosomes
to ancestors from whom they have been inherited. This requires
comparing DNA with second cousins or more distant relatives,
which allows regions to be attributed to specific grandparents
or more distant ancestors. This may exercise your brain cells a
little more than the first two approaches.
- Raw data
- Sooner or later, the only answer to a particular DNA puzzle
will be to look at one's raw data, in the form of long sequences
of pairs of As, Cs, Gs and Ts, in order to work out exactly how
and why something happened. This is for the specialist.
Lists of names
My initial autosomal DNA results were presented at
FamilyTreeDNA.com in the form of 36 pages
of matches, with 10 people per page; subsequently this was
increased to 30 people per page. In an attempt to avoid ambiguity,
I will call these people my FTDNA-overall-matches. The
term autosomal or Family Finder is implicit in this definition, as
those who have had their Y-DNA and/or mtDNA analysed by
FamilyTreeDNA will have different (possibly overlapping) sets of
matches from those analyses.
The silly mania for dividing everything into groups of 10 still
applies (as of 11 June 2017) to the screen for entering Current
Surnames, where the browser back and forward commands don't
even work properly between the groups of 10.
I have yet to find any formal definition of what the word "match"
means in this context or of what matching algorithm is used at
FamilyTreeDNA.com. The nearest to a definition that I can find in
the FTDNA
FAQs is:
The Family Finder program has calculated all of your matches to
be your relatives within the relationship range. Family Tree DNA
uses stringent standards for the relationship range and for the
degree of relatedness. Thus, only those determined with high
confidence to be your actual genetic relatives are included.
Where are the "stringent standards" published? How high is "high"
confidence? What statistical principles lie behind this secret
definition? Are user-entered known relationships used within the
matching algorithm, as appears to be the case for ancestry.com's
DNA matching algorithm?
At GEDmatch.com, the One-to-many
DNA comparison page at least allows the user to tweak the
parameters used to define a match. Note, however, that the
GEDmatch.com 'One-to-one' compare page by default once looked for
segments > 3cM in FTDNA data but only for segments > 5cM in
23AndMe data.
Who might match you?
Before looking at your match list, you might like to consider who
might match you, and how closely you might be related to your
matches.
After you have spent a while looking at your autosomal DNA
matches, you will inevitably begin to question both to what extent
the people on the long lists of matches thrown up by autosomal DNA
comparison are any more likely to be related to you than the
people that you might pass walking down the street in a place
where your ancestors lived for a couple of generations, and to
what extent you will be able to prove this using traditional
genealogical methods.
I have estimated that in somewhere like Ireland, where the
population is small and there was little inward migration in
recent centuries, it is unlikely that any two randomly selected
people with no tradition of recent immigrant ancestors are more
distantly related than about twelfth cousins. Mark Humphrys
argues that we Irish
are all descended from Brian Ború, the High King of Ireland
who was killed in battle in 1014.
This simple observation has profound implications:
- if your parents came from the same population, then they were
probably twelfth cousins or closer;
- if your match's parents came from the same population, then
they too were probably twelfth cousins or closer;
- so you and your match are probably related in at least four
different ways: paternal/paternal, paternal/maternal,
maternal/paternal, maternal/maternal;
- extending the analysis backwards, you and your match are
probably related in many more ways;
- if you and your match have a known recent common ancestral
couple, then one of that couple is probably the source of any
large half-identical region that you share with your match;
- the source of a small half-identical region that you share
with your match could be a more distant common ancestor of whom
you are currently unaware;
- if you and your match have a known recent shared ancestral
surname (e.g. Waldron), then a Mr. or Mrs. Waldron is probably
the source of any large half-identical region that you share
with your match;
- if your shared ancestral surname is common (e.g. Brown or
Kelly or Smith) or if your shared ancestral surname has multiple
genetic origins or if the half-identical region that you share
with your match is small, then you should be less confident that
a Mr. or Mrs. Brown (or whatever) is the source of that
half-identical region;
- if your shared ancestral surname is uncommon (e.g. Blackall or
Kett or Marrinan) or if your shared ancestral surname has only
one known genetic origin, then you can be more confident that a
Mr. or Mrs. Blackall (or whatever) is the source of the
half-identical region that you share with your match.
I will return later to the questions of how
long
is "long" and how close is "close"?
For now, I will just note that when I began to experiment
with DNApainter.com, I discovered that many half-identical
regions of up to 8cM with known relatives could not be confidently
traced back to our known most recent common ancestral couples, and
realised that I am probably doubly or multiply related to many
people with whom I have hitherto had only one known relationship. Be
wary of assigning anything smaller than 8cM to a particular
ancestor.
On the other hand, there are documented cases of people who found
each other because they were deemed to be autosomal DNA matches
discovering a paper trail which shows that they are more distantly
related than twelfth cousins. I personally have found a documented
ninth cousin twice removed because we were deemed (by
GEDmatch.com) to be autosomal DNA matches. It is of course
possible, if not probable, that there is a closer but less well
documented relationship between such distant cousins.
Lists of matches based purely on one-to-one autosomal DNA
comparisons will undoubtedly include some people whose
genealogical relationship cannot be established and omit some true
genealogical relatives. The extent to which you will be able to
filter the true genealogical relatives from the others depends not
only on the closeness of the DNA match, but also on the answers to
many questions which can not be considered by these pure
one-to-one autosomal DNA comparisons:
- Do any known relatives of either match also match the other
person? If so, how strong are these matches?
- Do the two people have ancestral surnames in common?
- Do the two people have ancestral places in common?
- Do any probable relatives of either match, based on common
ancestral surnames or ancestral places, also match the other
person?
- Do three or more known, probable or possible relatives all
match each other on the same regions, i.e. share segments that
all may have inherited from a single common ancestral couple?
- How long are those shared segments?
At this stage, some basic ideas about false positives (matches
with no known relationship to you) and false negatives (known
relatives who are not deemed to be matches) may be helpful.
False
positives and false negatives
Every statistical inference is subject to two types of error. For
no particular reason, they are known as Type
I
and Type II errors:
- A Type II error is a false negative; in the context of
genetic genealogy, it means failing to list a known relative
from the relevant database of test subjects on my match
list. This could be either
- because the two known relatives have not inherited any
common segment from their known shared ancestors; or
- because the two known relatives have inherited at least
one common segment from their known shared ancestors but
measurement error causes it to be missed; or
- because the two known relatives have inherited at least
one common segment from their known shared ancestors but the
matching algorithm does not recognise its significance.
- While these three causes may appear quite different to the
geneticist, they are essentially the same from the
statistician's or the genealogist's point of view. The
geneticist probably thinks of the hypothesis being tested as
that the subjects' shared DNA is identical by descent (true
positive) and not just identical by state (false positive),
whereas the genealogist thinks of the hypothesis being tested as
that the two subjects have a common ancestor.
- The FTDNA
FAQs (now moved here)
give these surprisingly small probabilities, at least beyond
third cousins, of not making Type II errors (i.e., in
statistical jargon, this table shows that the power or sensitivity
of the tests is surprisingly low):
23andMe has a similar table:
| Cousin relationship |
Probability of detecting |
| 1st Cousin or closer |
~100% |
| 2nd Cousin |
>99% |
| 3rd Cousin |
~90% |
| 4th Cousin |
~45% |
| 5th Cousin |
~15% |
| 6th Cousin and beyond |
<5% |
- The first thing to note from these tables is that when you are
ready to persuade known relatives to provide DNA samples, you
should start with your third cousins. For more distant cousins,
the probability that at least one of you has not inherited any
autosomal DNA from your most recent common ancestral couple is
high, diminishing the value of the test. For less distant
cousins, most of what you learn will probably not be new
information, also diminishing the value of the test. I will
return to this point later.
- It is not clear to me whether FTDNA's lower bounds come from
some mathematical (probabilistic) model or from experimental
sample data. Neither is it clear why lower bounds rather than
point estimates are given. (We will see later that in other
contexts FamilyTreeDNA likes to give point estimates where
confidence intervals are more appropriate.) Nor is it clear what
other unspecified factors might cause the power of the test to
be greater than the given lower bounds.
- Since the power of the test is so low for those who are not
closely related, my first idea when trying to place someone I
don't know who shows up as a close match would be to look at all
of his or her matches (not just our "in common with" matches) to
see if I recognise any of them as a known distant relative who
by chance matches the other person but doesn't match me. Under
present access rules for some of the DNA websites, this would
ideally require my close match to share his or her password, or
as a next best alternative to download and forward to me the
entire spreadsheet of all of his or her matches. GEDmatch.com
does allow users to view all the matches of a match (just click
the kit identifier in the first column of the relevant line of
the basic One-To-Many DNA Comparison Results).
- A Type I error is a false positive; in the context of
genetic genealogy, it means listing as a match someone who can
be proven not to be a relative within the specified Relationship
Range. I have so far not found any statement of the probability
of Type I errors. This probability is the significance level
used for the hypothesis test, so should be set to the industry
standard 5%. I am extremely sceptical that this is what the
FTDNA algorithm does and I believe that the proportion of false
positives returned is vastly greater than 5%. In other words,
the specificity
is much lower than the standard 95%. The probability that two
people are related is, of course, much larger than the
probability that that relationship can be traced and proven by
conventional genealogical means. Having reviewed my own first 36
FTDNA-overall-matches for which the Relationship Range does not
include "Remote Cousin", my genealogist's instinct is that the
proportion to whom I have any hope of proving a relationship is
far less than the theoretical 95%, or that the true
relationships are very likely to be more distant that the outer
limit of the estimated Relationship Range..
- We need a table showing the opposite calculations: to ensure
that, say, 80% of relationships are detected, what cM threshold
for half-identical regions should be used to determine which
such regions should be included in calculations? For
example, we might find that 80% of first cousins share a
half-identical region of 80cM or more; 80% of second cousins
share a half-identical region of 40cM or more; 80% of third
cousins share a half-identical region of 15cM or more; 80% of
fourth cousins share a half-identical region of 10cM or more;
80% of fifth cousins share a half-identical region of 4cM or
more. These figures are pure conjecture. If you have
access to a relevant data set, please consider doing some
calculations.
Setting
thresholds and designing matching algorithms
As with any hypothesis test, there is a tradeoff between
sensitivity and specificity when using DNA to test whether two
individuals are related. In the language of the preceding section,
reducing the probability of a Type I error will increase the
probability of a Type II error.
Choosing where to set the threshold is more of an art than a
science. The various DNA companies have all developed their own
matching algorithms, which can give very different results.
Here is an extreme example involving myself (VA864386C1) and a
man (A831973) who shares his surname with at least four of my 16
GGgrandparents, and shares one reasonably large half-identical
region with me:
- GEDMATCH: 7 131,376,672
150,778,055 27.9cM 2,741 SNPs
- FTDNA: 7 131515632
150764204 29.09cM 2807 SNPs
- ANCESTRYDNA: no match
In this case, I have more confidence in the conclusions by FTDNA
and GEDmatch than in those by AncestryDNA, as our ancestors not
only shared a surname but lived near each other.
In another case, with no common ancestral surnames and no common
ancestral locations, I might have more confidence in the DNA
company which does not deem there to be a match.
The other DNA companies should follow the example of GEDmatch and
allow their customers to choose where they would like to set the
threshold. At the very least, they should state clearly and
unambiguously where the threshold has actually been set.
The basic matching algorithms do not currently look at surnames
or family trees. Both AncestryDNA (ThruLines) and MyHeritage
(Theory of Family Relativity) are trying to develop more
sophisticated matching algorithms which combine DNA evidence and
genealogical evidence. In the future, the matching
thresholds and ranking of matches used by the DNA companies may be
revised to combine genealogical evidence with DNA evidence.
The Family Finder interface on the FamilyTreeDNA.com website
Major changes in the Family Finder interface were implemented on
6 Jul 2016. Parts of the following discussion may still need to be
revised in the light of these changes.
The only URL for the Family Finder interface is https://my.familytreedna.com/family-finder/matches.aspx.
There are various ways of customising the display, but in general
no parameters are added to the URL and no cookies are set to
remember your preferred view (if you are like me, this will
probably be with newest matches first and with Expand, formerly
referred to as Show Full View, turned on), so you cannot bookmark
your customised display and you must repeat the customisation
every time you go to the page.
Personally, I like to see my Family Finder matches ordered by
descending Match Date, so I have to click the Match Date column
header to resort the matches every time I visit my bookmark. For
Y-DNA matches, I have to click twice, as the first click sorts
with oldest first and the second click then sorts with newest
first. I suspect that all customers will want quick access to the
top 30 by Match Date, but this requires an additional
point-and-click after selecting your bookmark. The number of
FTDNA-overall-matches is displayed at the top of the list of
matches; if this has changed since your last visit, you will know
that you have at least one new match.
After accidentally managing to add a parameter to the URL, I
posted about this on 24 Mar 2015 at
https://www.facebook.com/groups/isogg/permalink/10153215548052922/
I have somehow managed to accidentally change the URL for my
Family Finder match list to
https://www.familytreedna.com/my/family-finder/matches.aspx?newSinceDate=20150313
Can any of the other filters be passed as arguments like this at
the end of the URL?
It would save loads of time if one could bookmark the match list
with "Show Full View" on and sorted by Match Date descending
instead of having to do two extra point-and-clicks for every kit
every time one checks for new matches.
It would save even more time if one could bookmark separately the
match lists for different kits instead of having to search for
passwords and visit log in and log out pages for every kit.
The icing on the cake would be to be able to go to a bookmark
submenu and select "Open All in Tabs" in order to simultaneously
open and view matches for all of one's kits with one's preferred
options automatically selected.
Each FamilyTreeDNA kit has an ekit identifier which is used in
URLs to avoid confusion when you share your Family Tree or DNA
results with project administrators or others.
To find your ekit identifier, go to your pedigree chart and select the "Share Tree"
button which is the fourth item from the right on the white menu
bar above your blank pedigree chart. This will display a URL in
the form http://www.familytreedna.com/my/family-tree/share?k=j0XmKW8S87H%2Ffjy92CTXbQ%3D%3D
Whatever appears after the equals sign in the URL is your ekit
identifier.
If you have access to multiple kits and want to bookmark pages
for particular kits, you can generally add ?ekit= followed by the
relevant ekit identifier to the end of any URL.This will be
particular helpful when you have become a project
administrator.
To upload your GEDCOM file to FamilyTreeDNA.com, just select the
"Upload GEDCOM" button which is the third item from the right on
the white menu bar above your blank pedigree chart at, e.g.,
https://www.familytreedna.com/my/family-tree?ekit=AyxNwlRR9Y6t4mCCdnLA%2fw%3d%3d#mode=1
There seems to be no means of viewing all my hundreds of
FTDNA-overall-matches in the same web browser window. I can,
however, see them all, sortable by all fields, in a single
Microsoft Excel window by clicking the Excel button at the bottom
right of the browser window. This causes Mozilla Firefox to offer
to open an XML Document in XML Editor. I am not familiar with
either of these, but clicking OK then opens a normal Excel window.
The file downloaded is not a properly formatted Excel file and is
probably just a CSV file: column widths are not set to match the
content width; panes are not frozen; autofilter is not turned on;
dates are not in my preferred Microsoft Windows date format;
e-mail addresses are not hyperlinked; long lists of surnames and
placenames are not set to wrap in a readable manner; etc. As I
will be re-downloading this file, I had to record this macro
in order to make it usable in Excel 2010. Hopefully the macro will
be of use to other FamilyTreeDNA customers. If you know how to use
a macro in Excel, hopefully you know how to copy and paste someone
else's macro into an appropriate place, and how to back up the
macros which you want to access via your Excel Add-Ins menu, which
Excel stupidly insists on storing in a fixed location in the
directory hierarchy.
Nick Reddan has sent me some helpful additional information on
Excel macros which I will be inserting here in due course.
For each FTDNA-overall-match, I can see the fields below either
in the web browser window or in the Excel window or in both
windows or somewhere else. The full (but invisible) list of
matches is sortable in the web browser by clicking on any of three
column headers (Match Date, Relationship Range or Shared cM); it
is also sortable by four additional fields (Name (married
surname), Longest Block, Y-DNA Haplogroup or mtDNA Haplogroup) by
selecting from a dropdown Sort By menu and clicking an Apply
button. These sorts in each case display the top 10
FTDNA-overall-matches by the chosen criterion. It is not possible
to bookmark or hyperlink to the top 10 in any order bar the
default Relationship Range order at https://my.familytreedna.com/family-finder/matches.aspx.
In Excel, FTDNA-overall-matches are naturally sortable by all 12
columns, including the following, by which it is not possible to
sort on the website: first name, Suggested Relationship, Known
Relationship, E-mail, first ancestral surname listed and Notes.
Since married surnames are not a separate column in the
spreadsheet, Excel cannot sort by them.
On the website,
one can click on any match's Full Name or mugshot to bring up a
Profile pop-up.
The following items of information are available for each
FTDNA-overall-match:
- Longest block [half-identical region] length:
- This is the field by which results are sorted in Excel (Column
F). Although to most experienced genetic genealogists it seems
to be the most significant indicator of a relationship, it is
not immediately visible in the web browser. It can be revealed
for an individual FTDNA-overall-match by expanding a tiny,
almost invisible, dropdown menu under each mugshot; or for all
10 visible FTDNA-overall-matches by pointing-and-clicking "Show
Full View" in the very small print at the top-left corner of the
FAMILY FINDER - MATCHES display.
- I initially thought longest block was seven clicks away: click
Family Finder, Chromosome Browser, Filter Matches By ..., Name,
[type name, don't hit <Enter> key], Find, tick checkbox
[don't click on the name], View this data in a table, scan the centiMorgans
column for the largest value. See the section about the
Chromosome Broswer below for more
details and some examples.
- I warn not to click on the name merely because this brings up
an invitation to "Enter Notes About This Relative" even if the
name is that of a complete stranger who merely shares a region
which is half-identical by chance.
- The average value of longest block length for my 354 initial
FTDNA-overall-matches was 10.30cM.
- Shared segments:
- The number of shared segments (i.e. the number of
half-identical regions of length 1cM or more) is not visible in
either the web browser window or the Excel window, but appears
after the sixth click in the above alternative path to the
longest block.
- Full Name:
- The full name may include a title (Mr. or Mrs.) in the web
browser, but not in Excel (Column A). In the case of Mrs., the
Full Name does not clearly indicate the maiden surname, the only
one of interest to the genealogist. Married women from different
cultures may indicate their maiden surnames in different ways,
for example as part of a double-barrelled surname or (in the
U.S.) as a middle name. The Full Name column is sortable by
first name in Excel, but not sortable by surname! One of my
FTDNA-overall-matches (Mr. Robert M. Elliott) appears to have
entered the "Mr." as part of his first names as it does appear
in Excel.
- Mugshot:
- On a randomly selected page, 2 of the 10 people had uploaded
mugshots. These are understandably not visible in Excel. If
there is no mugshot, then there is a helpful colour-coded
place-holder, blue for males and pink for females. The mugshots
that I have encountered have all clearly indicated the person's
gender, but one has to hope that FTDNA users (particularly those
with ambiguous first names) do not start uploading the sort of
gender-neutral profile pictures that have become commonplace at
facebook.com. Sometimes the customer name and the colour-coding
suggest different genders. I have even seen a customer first
name of "Jennifer and Brian"; this one was coded blue. Where the
gender is ambiguous to DNA matches, FTDNA should be able to
confirm it by checking whether the raw data shows one or two X
chromosomes. However, this error checking does not appear to be
as rigorously implemented as it should be. I have come across
cases where I am almost certain that a male's submitted DNA
sample has been linked to a female's transferred autosomal DNA
file, but have found no definitive way of either confirming or
refuting this theory.
- Profile:
- Click on either the Full Name or the Mugshot to reveal a
profile (not visible in Excel), which includes "Most Distant
Ancestors", "About Me" and "Ancestral Surnames". Some people
will have entered patrilineal and/or matrilineal Most Distant
Ancestors (also sometimes referred to as most distant known
ancestors or MDKA for short) but neither uploaded a
GEDCOM nor entered Ancestral Surnames. This is different from
the Family Finder Profile accessible from the chromosome
browser.
- E-mail address:
- A hyperlinked icon in the web browser; not hyperlinked in
Excel (Column H). It took a lot of googling to find this
page which taught me how to add appropriate hyperlinks
using my Excel macro!
- On mouseover, the e-mail icon turns blue and, if the person
can be contacted by e-mail, the cursor turns from an arrow into
a finger.
- There is an unexplained tickbox in front of the e-mail
address(es) on each customer's Contact
Information
page. If one of these tickboxes is ticked, then the
customer becomes contactable by e-mail by his or her
FTDNA-overall-matches. If none of these tickboxes is ticked,
then the customer remains uncontactable. I seem to have been
inadvertently uncontactable for the first few months after my
results became available. I figured out what I had done wrong on
11 January 2014, having been slightly puzzled that I hadn't
heard from any of my FTDNA-overall-matches.
- There are some simple rules
of etiquette which it is imperative to follow when
making contact with DNA matches by e-mail, whether by
personalised e-mail or by bulk e-mail to many matches:
-
- Don't just start your e-mail with "Hello cousin". You
could after all be dealing with a false positive match.
- A DNA match involves at least two people. The initial
e-mail must identify both parties - yourself and the
stranger you are approaching - clearly and unambiguously.
- Many customers use a single e-mail account for the DNA of
multiple different people, for example the DNA of the owner
of the e-mail address and the DNA of both of his or her
parents or the DNA of several cousins. Some of these people
may even be deceased, but their DNA data lives on. Thus when
making contact by e-mail one must mention the name of the
stranger whose DNA one matches. This rule applies to FTDNA,
probably to all the other DNA companies, and certainly to
meta-sites like GEDmatch.com.
- Similarly, many people use the same e-mail address for
multiple DNA websites. Thus when making contact by e-mail
one must mention on which website one found the e-mail
address.
- The stranger being contacted will want to see the genetic
information available about the DNA match that you manage.
Thus, one must identify one's own side of the DNA match in
the e-mail, by giving the matching person's name exactly as
it appears at FamilyTreeDNA.com or whichever DNA company
website is relevant and by giving one's GEDmatch kit
number.
- The stranger being contacted will want to see the
genealogical information available about the person
initiating contact. Thus, one must state whether one is
adopted or knows one's own genetic ancestry and, in the
latter case, one must provide a hyperlink, and password if
required, to a usable online family tree - at least until
such time as FamilyTreeDNA.com or GEDmatch.com provides a
usable interface for downloading or online viewing of GEDCOM
files. Don't ask for access to someone else's family tree
without first offering access to yours.
- Keep track of who you have written to and if you write to
the same person a second time at least refer back to your
initial attempt to make contact.
- One should also bear in mind general rules of
etiquette for e-mail correspondence.
- Note icon:
- Allows notes to be added on the website. These are then
included in Column L of the next Excel download.
- Family tree icon:
- A blue icon now indicates that the match has published a
family tree including some details of his or her known ancestors
and a grey icon in theory indicates that he or she has not (the
affirmative icon was originally green). Initially, the family
tree had to be prepared offline using conventional genealogy
software and uploaded as a GEDCOM file; this remains the optimal
method.
In mid-2014, FamilyTreeDNA destroyed its family tree system and
replaced it with a new system which allowed the family tree to
be directly entered on the website. This was presumably intended
to cater for the tiny minority of customers whose interest in
genealogy was sparked by DNA results rather than for the vast
majority of customers whose interest in DNA was sparked by their
genealogy results. It was the worst case of 're-inventing the
wheel' that I can remember.
It took until October 2016 for FamilyTreeDNA to add a
proper usable five-generation left-to-right pedigree chart
to its GEDCOM viewer, but even then it did not make this
the default view. Hopefully it will not take another three years
to persuade them that this must be the default view. It is
at least possible to bookmark the pedigree chart view, e.g. https://www.familytreedna.com/my/family-tree?ekit=j0XmKW8S87H%2ffjy92CTXbQ%3d%3d#mode=1
(Just replace my ekit identifier with your own or with the one
whose pedigree chart you want to see.)
- The convention that the grey icon in place of the coloured
icon indicates that the person has not either uploaded a GEDCOM
or manually entered a family tree changed without explanation in
2016. It appears that the coloured icon may just indicate that
there is some profile information available, not necessarily
including even the DNA subject's parents' names. This is not
part of the Excel download, where it would be extremely useful.
- A surprisingly and disappointingly small proportion of
users have published family trees - as few as one out of ten on
a randomly selected page. This may reflect the high number of
adoptees turning to autosomal DNA in the search for their
biological families, as an adoptee will not have the information
which should be included in the family tree.
Clicking on the family tree icon opens the family tree viewer in
a new tab. The HTML title of the new tab is "myFTDNA -
myFamilyTree" (previously "myFamilyTree" and before that again
"Family Tree DNA - Family Tree Viewer (GEDC ..."), although it
is generally not yours at all, but someone else's. Through three
changes, this title has continued to make no reference at all to
the name of the person whose family tree is displayed. Instead,
one ends up with numerous tabs open simultaneously, all
identically titled. A far more appropriate HTML page title
would be "[Maiden surname], [Given names]: FTDNA family tree
viewer".
- The identifying part of the URL shown in the address bar for a
family tree is equally uninformative, e.g. LzHMU7p8O9Y%3d. This
should be (and could easily be) replaced with the person's name
or kit number.
- One tiny improvement brought in at the same time as the 2014
downgrade was the addition of the match's name above the top
right corner of the family tree display; in the previous
interface, horizontal scrolling hid the details of the person at
the root of the pedigree, leaving the title bar and address bar
as the only potential way of identifying the subject of the
pedigree.
Since the introduction of computers for genealogy in the 1980s,
using computers with keyboards with PageUp and PageDown keys,
but no PageLeft or PageRight keys, genealogists have been
conditioned to see family trees horizontally, with the root
person as the left and ancestors to the right. Younger
genealogists who have grown up with pointing devices (such as
the mouse) and touchscreens have been conditioned differently.
Thus modern family tree interfaces increasingly require the user
to scroll right and left rather than up and down. This makes
life increasingly difficult for those still using keyboards.
The original pre-2016 FamilyTreeDNA family tree viewer created a
more serious information processing problem than this pure
human-computer interface problem. It displayed the ancestors on
each generation in a single row (vertical pedigree chart format)
rather than a single column (horizontal pedigree chart format).
Which method of displaying my grandparents is easier to absorb:
John Waldron Mary Ann (Ciss) McNamara Thomas Durkan Bridget
Durkan
or
John Waldron
- Mary Ann (Ciss) McNamara
- Thomas Durkan
- Bridget Durkan
Which would be easier to absorb if, instead of looking at four
grandparents, you were looking at 128 GGGGGgrandparents, as you
need to do when looking for the common ancestor who may be the
source of the DNA that you share with a predicted sixth cousin?
I practically gave up looking at or for family trees on sites
like FamilyTreeDNA.com, while awaiting single-click access to
standard multi-generation horizontal family trees. FamilyTreeDNA
finally made progress in this direction in October 2016.
- If I see the little coloured family tree icon beside a new
match in my FTDNA Family Finder match list, I still tend to
click on it, knowing that only frustration will result. I should
remember that lists of ancestral surnames are now automatically
populated by uploading GEDCOM files, so it is unlikely that
there will be any family tree where there is no list of
ancestral surnames. If the individual ancestral surnames were
entered manually, there will probably still be no family
tree. In the rare cases in which there is more than one
person in the family tree, I then have to switch from Family
View to Pedigree View in order to see the relevant information,
and my eyesight is poor enough in relation to my screen size
that I then have to switch my browser to full screen mode (with
the F11 key). (Ancestry.com's conventional left-to-right
layout with mouseover details long fitted four generations into
a tiny fraction of the space used by FamilyTreeDNA.com's
original bottom-to-top layout, and after many years of requests
from users, FTDNA finally switched over in October 2016.) When I
see an interesting name in a GGgrandparent box, there is
nothing on the display to tell me whether or not there are
further generations of that GGgrandparent's ancestry in the
GEDCOM.
If someone reinvented the wheel and decided that it should be
square rather than round, it wouldn't have looked as awful as
the pre-2016 FamilyTreeDNA interface.
- Linked Relationship:
- The October 2016 changes to
the interface introduced a Linked Relationship column to the
match list.
These "linked relationships" replaced the "known relationships"
in the previous versions of the user interface; older kits with
known relationships are requested to add the relevant people to
their family tree and link them to their DNA results.
In the FamilyTreeDNA family tree viewer (at least in some
browsers), one can link known relatives in the Family Finder
match list to the corresponding individuals already included in
the family tree, or add them as parent, spouse, sibling or child
to individuals already included. (I have found that this feature
works in Opera, but not in Firefox, where it produces infinitely
spinning timers or no reaction at all.)
There are two ways to use this feature:
- The Linked Relationship feature can be used to assign some
DNA matches to the paternal and maternal sides, i.e. those
matches who triangulate with known paternal relatives or
with known maternal relatives on regions of 9 centiMorgans
or more..
In the myFTDNA - myFamilyTree tab, there is a
DNA Matches button at the left of the second menu from the
top.
This toggles a DNA Matches column at the left-hand side of
the screen, which initially shows your top six Family Finder
matches.
It has a "Find your matches" search box at the top and a
navigation bar at the bottom which can be used to locate
more distant matches.
When you find a match that you want to link to your family
tree, just drag and drop from the DNA Matches column to the
relevant individual in the tree, or to a parent, spouse,
sibling or child if the individual is not yet included.
After you drop, you will be asked to select the relationship
between the DNA match and the family tree entry (father,
mother, spouse, self, sibling, son or daughter).
You are also asked whether to send an e-mail to the match
announcing that you have created the linked relationship; I
generally untick this box before clicking the Confirm
button, as I think that FamilyTreeDNA already generates far
too many unnecessary e-mails.
When you return to the Family Finder match list after
creating Linked Relationships, you will (usually only
briefly) see a spinning timer and a blue "Calculating Family
Matching" message to the right of the
All/Paternal/Maternal/Both menu.
After family matching completes, you will see the number of
confirmed Paternal and Maternal (and Both) matches in
brackets on the relevant tabs on this menu, and a blue icon
for paternal or a red icon for maternal to the left of
the mailto: link under the names of the relevant matches.
Click on the relevant tab to view just Paternal, just
Maternal, or just Both matches.
In creating the two subsets, of paternal and maternal
matches, the family matching process has of course also
created as many as four further subsets for each grandparent
(containing matches who triangulate with second cousins
etc.) and eight further subsets for each greatgrandparent
(containing matches who triangulate with third cousins
etc.). It then merges the subsets for father, paternal
grandparents and paternal greatgrandparents into the
Paternal bucket; and merges the subsets for mother, maternal
grandparents and maternal greatgrandparents into the
Maternal bucket;
Separating the maternal from the paternal is attempted only
where (a) the customer has matches who are known relatives
who are third cousins or closer, (b) the customer has
uploaded a GEDCOM file or manually entered a family tree
which includes these known relatives and (c) the customer
has linked the DNA matches to the corresponding people in
the family tree (in a browser in which this linking works).
If you click on the paternal and maternal tabs without going
through these three steps, then nothing happens. I have seen
an example of a match list
including Linked Relationships to two 3rd Cousins 1R
and a 2nd Cousin 2R, who were the second, third and fourth
closest matches at the time, but none of whom was assigned
to either the paternal or maternal category; however, the
top match, a 2nd Cousin 1R, is one of 31 matches in the
Paternal bucket. [The hyperlink to this example will only
work if you are logged in as an administrator of one of the
projects to which the kit belongs, but the screenshot below
shows everything.]
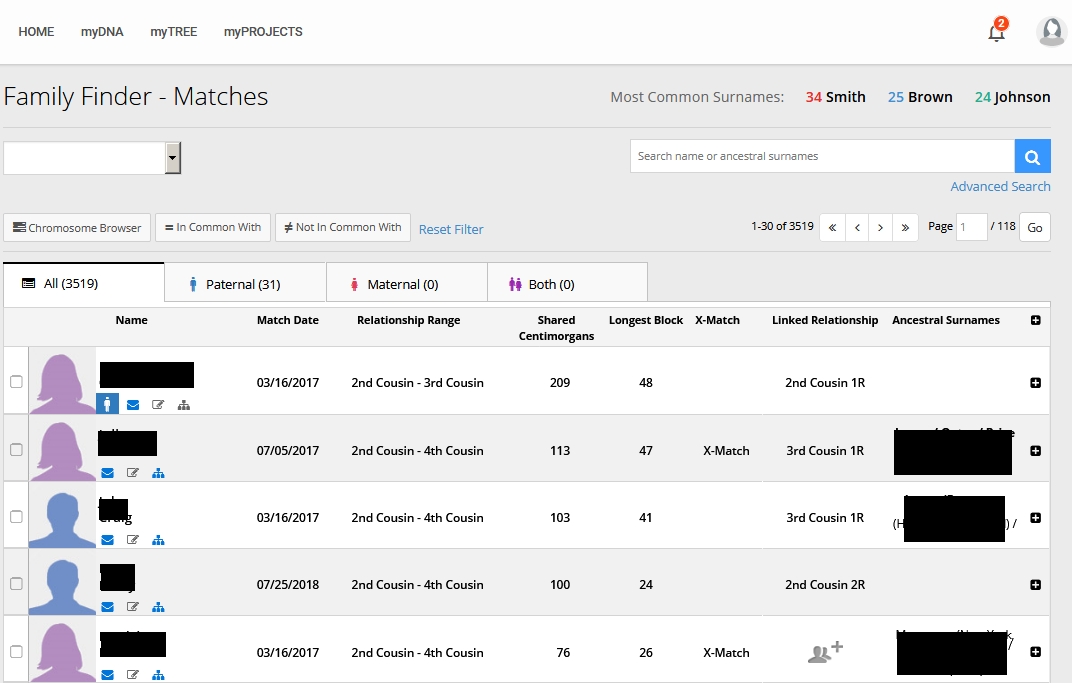
In principle, for a customer who has one parent's DNA
available for comparison, all the kits not identified as
matching that parent (e.g. paternal) should be associated
with the other parent (e.g. maternal). The fact that they
are not automatically marked as such is apparently an
admission that some may be merely half-identical by chance
to the child. Where no parental DNA is available for
comparison (as in my own case), parental phasing is still
done based on more distant paternal and maternal relatives,
but in this case there will almost always be matches who
cannot be assigned to paternal or maternal categories
because they match the customer in regions where no known
relative matches him or her.The filtering of paternal and
maternal categories leaves something to be desired - a
customer with DNA from one parent, say a father, can view
all the matches which ARE labelled paternal, but there is no
equivalent filter to show all the matches which ARE NOT
labelled paternal.
- When I find a new match, I am usually anxious to see the
matches that I share with the new match, which most of the
DNA comparison websites allow me to do in some form or
another.
I would like to know further which of these shared matches
are also triangulated matches.
MyHeritage automatically marks the triangulated matches on
the shared match list; AncestryDNA refuses to identify the
triangulated matches; GEDmatch and other third party tools
provide ways and means of finding the triangulated matches;
but one has to be a little devious to find the triangulated
matches directly at FTDNA.
In fact, the Linked Relationship feature can
alternatively be used to identify all the other matches who
triangulate with a particular match of interest.
To do this, you will want to have just one linked
relationship at a time on one side, say Paternal. You can
just link the match of interest temporarily as a new child
to a paternal grandparent (or more distant paternal
ancestor) in the family tree.You should mark this new child
as living, to avoid any chances that your matches or project
administrators interpret this device as proof of a
relationship.
Family matching will then put all the matches who
triangulate with you and the match of interest in the
Paternal bucket. You can still use the Maternal bucket in
the normal way to collect your triangulated maternal matches
(or you can use a maternal ancestor in this procedure and
use the Paternal bucket in the normal way).
When you have recorded the list of triangulated matches, you
should probably reverse the process by returning to the
myFTDNA - myFamilyTree tab and deleting the individual from
the tree.
Then you can repeat the process for any other match of
interest.
If you want to use the Linked Relationships feature both for
bucketing both Paternal and Maternal matches and for identifying
triangulated matches with individual matches, and if your
matches include known third cousins or closer on both paternal
and maternal sides, then you may want to have two Family Finder
kits, e.g. a kit based on swabs sent to FTDNA with a full
pedigree chart for paternal/maternal phasing; and a kit based on
an autosomal transfer from another laboratory with a minimal
pedigree chart (including at least one grandparent) for
identifying triangulated matches.
For more discussion of Linked Relationships, see the Analytic Genealogy blog and the facebook discussion which resulted.
- Run Common Matches icon (formerly, but briefly, described as
Run Triangulate):
- When comparing the results of person W to those of person Z,
with the objective of identifying their most recent common
ancestral couple and proving their genealogical relationship,
one must combine the evidence from traditional genealogy with
that from genetic genealogy. Some pieces of the jigsaw puzzle
will come from each of the two fields. Ancestral surnames and
ancestral placenames (see below) are
probably the most important clues. A further well-known
technique for getting around brick walls is that of going
sideways in order to go backwards in time. This means looking at
evidence relating to siblings and cousins and mutual relatives
for clues relating to shared ancestors. If the genetic evidence
suggests a relationship between W and Z, four probably
overlapping groups of possible mutual relatives will be of
particular interest:
-
- those who are known relatives of both W and Z;
- those who are known relatives of W and
FTDNA-overall-matches of Z;
- those who are known relatives of Z and
FTDNA-overall-matches of W; and
- those who are FTDNA-overall-matches of both W and Z.
- In an ideal world, all four groups will be identical. In
practice, many pairs of known distant relatives will not be
FTDNA-overall-matches as either or both of the pair will not
have inherited sufficient autosomal DNA from their most recent
common ancestral couple to be deemed FTDNA-overall-matches.
- The FamilyTreeDNA.com website provides no obvious way of
identifying people in the first three of these groups. However,
the Run Common Matches icon allows one to filter
FTDNA-overall-matches to see just those who are
FTDNA-overall-matches of both W (the kit logged in) and Z (the
kit on the current line). These are referred to as the "In
Common With" FTDNA-overall-matches (ICWs) of the
two kits.
- These ICWs can then be downloaded into a smaller spreadsheet;
for some bizarre reason this smaller spreadsheet does not
include any information about either of the two people with whom
those included are in common! For someone managing multiple
kits, this can potentially become very confusing.
- If one wishes to investigate possible relationships with two
DNA matches (however defined) and if one knows that these two
people are, say, second, third, fourth or more distant cousins
of each other, then the number of ancestral lines requiring
investigation is immediately reduced from 8, 16, 32 or more
between the two matches to just a single common line, a vastly
simpler and less time-consuming task. In other words, having
access to known relationship between one's DNA matches is an
essential element of the genetic genealogist's toolbox which
FTDNA fails to provide to its paying customers.
Looking at ICW matches is effectively the first step in the
techniques of phasing and triangulation to which I will return below.
- Match Date:
- One of the three fields on which the web results can be
sorted. In North American all-numeric mm/dd/yyyy format on the
web page. All genealogists know that the use of ambiguous
all-numeric dates is a mortal sin, guaranteed to lead to the
hell of confused months and days for events in the first 12 days
of any month. My macro,
inter alia, converts the Excel date (Column B) to my own
preferred yyyy-mm-dd format.
- Many Match Dates were inexplicably reset around 26 April 2014
to 4/26/2014.
- Relationship Range:
- This is the primary field by which results are sorted by
default in the web browser, but not in the Excel download
(Column C). Where is the algorithm explaining how it is
calculated from the numeric results?
In my case, this range takes on one of five values:
- 1st Cousin, Half Siblings, Grandparent/ Grandchild, Aunt/
Uncle, Niece/ Nephew
- 2nd Cousin - 4th Cousin
- 3rd Cousin - 5th Cousin
- 4th Cousin - Remote Cousin
- 5th Cousin - Remote Cousin
- Suggested Relationship:
- Column D in the Excel spreadsheet, but not shown in web
browser. This appears to be completely determined by the
Relationship Range. In my case, the Suggested Relationships for
the five observed Relationship Ranges are respectively:
- 1st cousin
- 3rd cousin
- 4th cousin
- -
- -
- I have always found it counter-intuitive that the margin of
error for the percentage share of the vote in an opinion poll is
a fixed number of percentage points, whatever the actual
estimated percentage share.
- I find the relationship (no pun intended) between the
Relationship Range (confidence interval?) and Suggested
Relationship (point estimate?) in this case counter-intuitive
for the opposite reason.
- I would expect the Suggested Relationship to be near the
mid-point on the Shared cM scale (see below) of the Relationship
Range. For example, third cousins are expected to have Shared cM
16 times as large as fifth cousins. The mid-point on the Shared
cM scale is 8.5 times, which is quite close to 8 times, which
corresponds to third cousins once removed.
For some reason, the point estimates are the mid-points on the
cousin scale, not the mid-points on the Shared cM scale. Why?
- Does "Suggested" mean what statisticians call "Estimated"? If
so, then is it a maximum likelihood estimate? I can't think of
any other estimation method for a discrete parameter.
See further discussion of this point in the ISOGG
facebook group.
- Known Relationship, replaced by Linked Relationship on 19
October 2016:
- This was a user-entered field, which must then be confirmed by
the other relative. There is a limited dropdown menu of
possibilities with the vague "Distant Cousin" hidden in the
middle to cover any omitted relationships. "Distant Cousin" is
NOT a "Known Relationship"!
- There should be submenus or numeric fields to allow any degree
of cousin and any degree of remove to be selected. What will I
do if I find one of my 3rd Cousins 3R?
- There should be a method for entering names, dates and places
for all the ancestors between the two known relatives and their
most recent common ancestral couple; perhaps this is the reason
for introducing the horrible new family tree interface in 2014.
- There should be a method for recording known distant
relationships between two FTDNA customers who are not deemed to
be FTDNA-overall-matches.
- If and when I find and enter known relatives, this field will
be downloaded as Column G in the Excel spreadsheet.
- As mentioned above, there should be
a way to identify those who are either FTDNA-overall-matches or
known relatives of the kit logged in and also are either
FTDNA-overall-matches or known relatives of the kit on the
current line.
- The absence of a quick route to this essential information is
a major drawback of the website. If the two people who have
agreed the Known Relationship have also both uploaded GEDCOMs,
then it may be possible, if difficult, to work out the
relationship.
Once the Known Relationship filled is filled in, the
Relationship Range becomes blank in the web interface; however,
it remains unchanged in the Excel spreadsheet.
- Linked Relationship (introduced 19 October 2016):
- Clicking on the icon in this column opens an `Add to Family
Tree' tab.
The linked relationships out to 3rd cousins are used by the Family Matching tool.
There is a Linked Relationships Page.
- Shared cM:
- Presumably the sum in centiMorgans of the lengths of all
half-identical regions longer than some unspecified minimum
length, probably 1cM. Also represented by a graphical icon,
which wastes a lot of valuable real estate in the web browser
window, forcing other more important variables into the hidden
dropdown underneath. For distant relatives, the graphical icons
are so similar that they are much less informative than the
numerical representation (in which trailing zeroes are properly
included here). Column E in the Excel spreadsheet. Average value
for my 354 initial FTDNA-overall-matches was 33.42cM.
- Ancestral Surnames:
- Ancestral Surnames are displayed in two places in the web
interface: as part of the Profile accessed by clicking on Full
Name or mugshot and by mouseover in the rightmost column.
- In both places, the first few words are visible in the web
browser window, and the remainder in a pop-up with a completely
unnecessary nested scrollbar. (I absolutely hate nested
scrollbars.) Clicking on the list allows the PageUp and PageDn
keys to be used. The list cannot be dismissed with the
<Esc> like most such pop-ups, so one has to
point-and-click the X in the top right corner of each version.
- Surnames and Locations can be entered by selecting the
Surnames link at the end of about the sixth menu from the top of
the myFTDNA
- Genealogy page.
- While Surnames and Locations are entered separately, they are
combined for display purposes into a single long line of text.
In the Profile version, locations are in []s and entries are
separated by ", ". In the direct version, to avoid any
appearance of consistency, locations are in ()s and entries are
separated by " / ". The entry of ancestral surnames is possible
without uploading a GEDCOM. The order of entries is unclear:
should it be alphabetical, or ahnentafel order, or perhaps
whatever random order the user entered the names in? Surnames
shared with the person whose kit is logged in, and similar
surnames, are bolded and moved to the front of the string of
names. There appears to be no limit on the number of entries
allowed. If known relationships are limited to 6th cousins, then
should ancestral surnames not be limited to GGGGGgrandparents,
or 128 surnames, not allowing for spelling changes or surnames
not conventionally inherited? Even that is too many to be of use
in free form unsortable text.
- The Surnames and Locations should be displayed in two separate
columns as they were originally entered, sortable by Surname,
sortable by Location and sortable by whatever the mysterious
default order is. I might even tolerate nested scrollbars if the
content was made useable in this way!
- In Excel 2010 (Column I), to find people using a particular
word in this field, click the auto-filter dropdown in Cell I1,
type F then A then the word of interest then <Enter>.
- Ancestral Placenames:
- Hidden in with ancestral surnames. This should surely be a
separate field. It should be (but is not) possible to download
this information into a spreadsheet with one line per ancestral
surname and/or one line per ancestral placename for further
analysis.
- Y-DNA Haplogroup:
- Shown, if applicable (i.e. for males) and available (i.e.
customer has paid for it and order has come to the head of the
queue) on the tiny, almost invisible, dropdown menu under each
mugshot and in Column J of the Excel spreadsheet. N/A clearly
means not-paid-for in the case of male matches but
not-applicable in the case of female matches.
- mtDNA Haplogroup:
- Shown, if available (i.e. customer has paid for it and order
has come to the head of the queue) on the tiny, almost
invisible, dropdown menu under each mugshot and in Column K of
the Excel spreadsheet. N/A clearly means not-paid-for in the
case of all matches. Using different abbreviations for
not-paid-for and not-applicable rather than using N/A for both
would greatly help to reduce the potential for confusing
beginners.
FamilyTreeDNA
What was I expecting to find?
- As of 6 Nov 2013, the offline version of my genealogy
database contained 7,217 known relatives who were either
my GGGGgrandparents or known to be descended from my
GGGGgrandparents. All of these are my fifth cousins or more
closely related (possibly some number of times removed). A lot
of them are dead, but many of them are still alive. I did expect
to find that at least one of them had done the autosomal test
with FamilyTreeDNA and would show up as an FTDNA-overall-match,
but no such luck.
- No known relative at all appeared among my initial 354
FTDNA-overall-matches.
- Until I found the table above, I
didn't realise that I can't expect to find one of these 7,217
among my FTDNA-overall-matches until a lot more than one of them
have tested with FTDNA.
- I have discussed DNA testing with a number of known relatives,
but didn't feel that I could push them to test until I had done
so myself. As you have probably read at the top of this page, I
am now pushing as hard as I can (without picking up a bill which
could run into hundreds of thousands of dollars if all my known
relatives agreed!).
- My friends and relatives probably know by now that I hate
Christmas. Not being a materialistic person and having a dread
of shopping, I particularly hate being asked 'What do you want
for Christmas?' and the pressure to reciprocate. As Christmas
lights started to go up everywhere while I reflected on my newly
received initial results in late November 2013, I suddenly for
once had an answer for any relative who asked that dreaded
question: 'I want you to sign up for the autosomal DNA Family
Finder Testing at FamilyTreeDNA.com!' In return, I can hopefully
at least give anyone who obliges a more complete family tree
than would otherwise have been possible.
- I have a number of known fifth cousins and even sixth cousins
with whom I have proven relationships using a wide variety of
sources, ranging from the Registry
of
Deeds, to inheritance cases, to the
combination of oral tradition and the writings
of Sir Hal Blackall, to a little helpful
note in the Kilkeedy burial register. However, surviving
Irish church and civil and census records generally do not go
back far enough to confirm most of these relationships.
Additional DNA confirmation would be nice to have.
- In the long term, if all my known relatives test, it should be
possible by chromosome mapping to reconstruct the DNA of all of
our ancestors - possibly not exactly, but certainly in the form
of some sort of posterior probability distribution. If I find
someone who both has matching autosomal DNA and is a known
relative, we can presumably deduce that our longest
half-identical regions were almost certainly inherited from one
of our most recent ancestral couple. Every such person will add
another piece to the jigsaw puzzle.
What did I actually find?
- I should probably concentrate first on contacting the four
closest FTDNA-overall-matches (Relationship Range 2nd Cousin -
4th Cousin; Suggested Relationship 3rd Cousin); then on the next
36 for whom the Relationship Range does not include "Remote
Cousin"; and probably dismiss the other 314 for whom the
Relationship Range does include "Remote Cousin". Some sort of
colour coding (say green, amber and red) to distinguish between
these three groups might have helped to highlight at first
glance the significant differences between these groups.
- If one feels overwhelmed by the number of
FTDNA-overall-matches, one can turn off the display of
Speculative, Distant, Close and/or Immediate Family Finder
matches on the Match and Email Settings page. This means
both that you will not see people deemed to belong to the
categories that you have switched off, and that they will not be
able to see or contact you. If you wish to use Family Finder
purely as a paternity test, you can do this by switching off
everything except Immediate. On the other hand, if you learn of
a known or suspected relative who has submitted a DNA sample to
FamilyTreeDNA and are surprised that he or she does not show up
in your match list, this may be because you have switched off
the relevant category of matches.
- Only one of my four closest FTDNA-overall-matches has uploaded
a GEDCOM.
- 124 of my initial 354 FTDNA-overall-matches have left the
Ancestral Surnames column completely blank, frustratingly
including the top three people in both the web browser and Excel
orderings, and 13 of the 36 people for whom Relationship Range
does not contain Remote Cousin.
- Only when I established contact with my closest
FTDNA-overall-match did I realise that many of those with
missing GEDCOMs and blank Ancestral Surnames columns could be
adoptees. Could the percentage of adoptees testing be as high as
implied by the above ratios? I will go into this example in more
detail below.
- My own surname Waldron does not appear in the spreadsheet, per
se. However, there are two people (same surname, same e-mail
address, probably father and daughter) listing Waldronde, in
Berkshire, England. My earliest known Waldron ancestor, my
GGgrandfather, was born in County Roscommon, Ireland in the
1820s.
- My mother's surname Durkan/Durkin (which, as noted above, was the maiden surname of three
of her four grandparents, so is potentially the source of up to
37.5% of my autosomal DNA) appears as the surname of one
FTDNA-overall-match, but not among his ancestral surnames, or
those of any other FTDNA-overall-match. There is one person with
Durkee, a new variant to me, or more likely a completely
different surname, among ancestral surnames.
- Despite this, there are at least two people that I know on the
list:
- Gerard
Corcoran (4th Cousin - Remote Cousin), whose talks I
attended at the afore-mentioned BTOP show: We both have
Walsh ancestors, but they are in different parts of Ireland,
and mine now has a big question mark as I suspect sloppy
research by the cousin who gave me the information many
years ago.
- Terry
Fitzgerald (it is actually her mother's DNA which
suggests 5th Cousin - Remote Cousin): I will also go into
this example in more detail below.
- I once had a student named Carleen Doherty, and there is
an e-mail address on the list (5th Cousin - Remote Cousin)
with username carleendoherty. It's not the commonest
combination of names in the world, but perhaps not unique.
- Terry's is just one of many e-mail addresses which are
associated with multiple DNA samples of different family
members.
- My top ten FTDNA-overall-matches, which are the same both by
Relationship Range and Longest Block, include no less than five
members of the Dengen family, sharing an e-mail address - a
mother and four of her children. I will also go into this
example in more detail below.
- My mother and all her known ancestors lived in County Mayo.
Filtering the Ancestral Surnames column of the spreadsheet shows
that 12 of my initial FTDNA-overall-matches use the word Mayo in
the Ancestral Surnames field. For four of them it is a surname,
for eight of them it is a placename.
- That got me wondering: how common is Mayo as a surname? Might
I actually have relatives named Mayo? Is the surname derived
relatively recently from the placename?
- Then I got wondering about other common surnames: 12 of my
initial 354 FTDNA-overall-matches have Sullivan in the Ancestral
Surnames field. Is that more or less than the proportion of the
entire FamilyTreeDNA database who have Sullivan in the Ancestral
Surnames field? How can I find the answer to that question? (I
have no known Sullivan ancestor.)
- Another common Irish surname, which does appear among my
ancestors, appears in the Ancestral Surnames column 13 times,
variously rendered as oconnor, Connor, Connors or O'Connor. Are
these 13 surname matches any more significant than the 12
Sullivan surname matches?
- I am clearly not alone in realising that the frequency of
surnames among the ancestral surnames of my
FTDNA-overall-matches is meaningless without information on the
frequency of these surnames among the ancestral surnames of all
FTDNA customers. 23andMe has a surname view in which surnames are sorted
by enrichmentwhich is
defined to be "how common a particular surname is among your DNA
Relatives matches, compared to the entire 23andMe database". The
surname view includes surnames listed by five or more of one's
matches. This simple idea would add infinitely to the value of
the FamilyTreeDNA database if adopted. Does AncestryDNA have a
similar way of viewing relative surname frequencies?
- Around 2014, FTDNA did introduce lists of the three Most
Common Surnames for each Family Finder subject.
For six people in the O'Deas of Newtown project as of 15 Sep
2015, these were:
Smith (7), Williams (6), White (4)
Smith (6), Johnson (5), Murphy (5)
Smith (9), Moore (7), Jones (6)
Smith (11), Moore (8), Brown (8)
Smith (11), Jones (8), Taylor (6)
Brown (8), Smith (7), Cooper (6)
Edward O'Dea, the most recent common ancestor of these six
people, did have a granddaughter married to a Smith, but these
statistics still appear to tell us more about the distribution
of surnames in the entire FTDNA database than among the
relatives of Edward O'Dea.
- Can the Ancestral Surnames column (and ancestral placenames,
when separated) be populated automatically from an uploaded
GEDCOM?
- I can filter by any specific Ancestral Surname, but how can I
filter by the number of matching Ancestral Surnames?
- I had to do this to extract and analyse the Ancestral Surnames
column:
- copy it to a text editor
- change every " / " to a line break
- change every " (" to a tab
- remove every ")"
- paste into a new spreadsheet
- insert a row of headers
- Alt D P to create a pivot table
- I managed to extract the (quite large) frequency table here from
the pivot table
- Apart from "Unknown", Parker with 10 occurrences is the
most common of my own ancestral surnames; 15 of my ancestral
surnames were not shared by any of my initial 354
FTDNA-overall-matches.
- This would work better if the characters used as delimiters
between surnames and placenames (brackets) were not also allowed
as parts of surnames or placenames!
- I ended up with 5,942 surname lines from 354 people,
suggesting that FTDNA customers have entered an average of just
over 16 ancestral surnames each.
- I've spotted only one Irish townland where I have known
relatives (Barnacahoge, County Mayo), but most placenames are at
county, country or state level only.
- On the Keas/Keyes side, I did find one person whose Keas
ancestor I recognised as having lived in the same Catholic
parish as mine (Patrickswell, County Limerick). However, fifteen
years of conventional genealogical research have failed to prove
the precise relationship between the two neighbouring Keas
families, and the DNA evidence appears unlikely to advance the
search for proof.
- There are two other people listing Keas/Keyes as an ancestral
surname, one in Germany back to 1813 and the other in the USA
back to 1671, surely just coincidence as my GGGGgrandfather John
Keas lived in Ireland and was born in the 1770s.
- I have e-mailed a few people to see what happens, and my 5th
cousin Cindy Wood, the Keas expert, has e-mailed a few others.
- I also persuaded Cindy to submit a sample of her DNA to
FamilyTreeDNA but when her results came back on 14 January 2014
we were not deemed FTDNA-overall-matches and had precisely one
FTDNA-overall-matches in common (Raphael Matthew Whelan).
GEDmatch.com confirmed that Cindy and I have half-identical
regions of 4.6cM (875 SNPs), 3.8cM (1177 SNPs), 3.5 cM (731
SNPs) and 3.2 cM (876 SNPs). Some or all of these are probably
half-identical by descent from either our common GGGGgrandfather
John Keas (d. 8 August 1845) or his unknown wife.
- As noted above, I did not realise until
11 January 2014 that I had switched off the facility for other
people to e-mail me!
- On 21 March 2014, I made contact for the first time with
someone with whom an initial DNA connection resulted (within
hours) in establishing a known relationship (ninth cousin twice
removed). We are not FTDNA-overall-matches, so our initial
contact was via facebook.com and GEDmatch.com.
- My first real success arising from autosomal DNA matching came
courtesy of my paternal first cousin's next closest match after
myself by Relationship Range (2nd Cousin - 4th Cousin). As he
had a completely blank Profile and blank Ancestral Surnames list
and an e-mail address in Houston, Texas, I did not bother
contacting him. Some months later, I met someone I knew with
exactly the same name, and asked him if he had a namesake in
Texas. It turned out that he was the same person and had been
persuaded to give a DNA sample by a roots-hunting visitor from
Texas who manages his DNA kit.
We soon established that we were each descended from a woman
with the maiden surname O'Dea who lived in the Catholic parish
of Patrickswell, Lurriga and Ballybrown in County Limerick in
1821.
Thinking about this situation gives rise to some general
principles for such cases.
If you find two people whose DNA is half-identical in a
particular region and who have ancestors who shared the same
surname and lived in the same area around the same time, then it
is reasonably safe to conclude that the shared DNA is inherited
from a most recent common ancestor with that surname (possibly a
female, for whom it would then be her married surname).
Given this conclusion, one must consider the possibilities that
the known contemporaneous ancestors are brothers, first cousins,
second cousins, etc., or, equivalently, that the MRCA is the
parent, grandparent, greatgrandparent, etc., of the known
contemporaneous ancestors.
If the MRCA is the parent, then the probability that the two
siblings inherited the same segment in the region of interest is
1/2.
If the MRCA is the grandparent, then the probability that the
two grandchildren inherited the same segment in the region of
interest is 1/8 (probability 1/2 that both parents inherited the
same segment multiplied by probability 1/2 that the first
grandchild inherited it multiplied by probability 1/2 that the
other grandchild also inherited it).
If the MRCA is the greatgrandparent, then the probability that
the two greatgrandchildren inherited is 1/32, for GGgrandparents
it is 1/128, and so on.
If we assume that the two contemporaneous ancestors are from the
same generation (and not, for example, uncle and nephew), then
the conditional probability that they are siblings is 75%, first
cousins 18.75%, second cousins 4.6875%, and so on. The
conventional 95% confidence interval encompasses the cases of
siblings, first cousins and second cousins. Evidence from
conventional genealogical sources or from other types of DNA
(mtDNA or Y-DNA or X-DNA) will be required to distinguish
between these possibilities.
In the O'Dea case, the DNA evidence first of all finally
confirmed which of several candidates was the wife of my
GGGGgrandfather John Keas, namely Maria O'Dea. 1821 was the year
in which their last child was baptised, and the year in which
the younger Bridget O'Dea married John Ryan. Comparing further
family folklore confirmed that they were closely related. Each
named one of her older sons Edward, so it appears possible that
both were daughters of Edward O'Dea, who died on 19 December
1830 aged 74 and was buried in Kilkeedy Cemetery. If so, then
the two FTDNA-overall-matches are fourth cousins twice removed,
closer than suggested by my own match list (no relationship) but
not as close as suggested by my first cousin's match list (2nd
Cousin - 4th Cousin).
Maria and Bridget may have belonged to the O'Dea family which
continued to live in the townland of Newtown (in Kilkeedy civil
parish) up to the mid-20th century. We are now trying to track
down female line descendants of these two O'Dea women, in the
hope that comparison of their mitochondrial DNA will confirm
that they came from the same female line. In the meantime, I set
up a Family Finder Project called O'Deas of Newtown on 24
November 2014. If you believe that you may be descended from
Edward O'Dea and wish to join the project, log in to your own
FamilyTreeDNA.com account and then go here and point-and-click the Join button.
So far, there are four members with paper trails to either Maria
or Bridget O'Dea, but only two of the six pairs are
FTDNA-overall-matches.
- Another success story later resulted in a conundrum for the real autosomal DNA
nerds:
In the summer of 2015 via GEDmatch I found a fourth cousin
(Dana) to whom I am half-identical for 44.6cM on Chromosome 12
(93,176,484 to 125,287,936).
Later in 2015 via the Marrinan Family Reunion facebook group, I
found another match (Bob) who is half-identical to both of us
for 11.7cM within that region (116,665,672 to 125,064,434) and
half-identical to me for a further 4.2cM up to 126,483,038.
There appears to be a fuzzy boundary between 125,064,434 and
125,287,936 (0.5cM) where I am half-identical by chance to Dana
but she is not half-identical to Bob.
I am happy to deduce that the DNA shared by Bob, Dana and myself
is also shared with either Hugh Clancy or Marcella Blackall, the
common GGGgrandparents of Dana and myself.
Now the complicated bit:
My first cousin (Antoin, also a fourth cousin to Dana) is also
half-identical to Bob, also on Chromsome 12, also between
112,242,549 and 116,643,188 (9.4cM, 1529 SNPs), but Antoin is
not half-identical to either Dana or myself in this
sub-region. Hence, the DNA shared by Antoin and Bob cannot
come from Hugh Clancy or Marcella Blackall. It could have
come from Antoin's father, or from our common grandfather.
However, for geographical reasons, it seems more likely to have
come from our common grandmother, Ciss McNamara, as she alone
was from the same part of County Clare as Bob's ancestors.
If so, then Ciss must have passed on her maternal Clancy
chromosome in this region to my father, and passed on different
DNA, in other words her paternal McNamara chromosome, to
Antoin's mother.
So I deduce that Bob is probably doubly related to Antoin and
myself, probably both through our McNamara greatgrandfather and
through our Clancy greatgrandmother.
That leaves the puzzle of the little gap from 116,643,188 to
116,665,672 where Bob is not half-identical to either Antoin or
myself.
My results are from FTDNA, which looks at only five SNPs in this
gap:
"rs11068648","12","116643188","CC"
"rs7964607","12","116643307","GG"
"rs975666","12","116646955","TT"
"rs2174412","12","116657099","GG"
"rs1976500","12","116657522","CC"
"rs479810","12","116660573","TT"
"rs17619048","12","116665672","TT"
Bob's results are from Ancestry, and an Ancestry raw data file
that I consulted has only one SNP in this gap, one that FTDNA
doesn't look at:
rs1818056 12
116645420 T C
So my conclusion is that somewhere in Bob's ancestry there was
probably a crossover between what I will call McNamara DNA and
Clancy DNA, somewhere within this little gap.
It remains to find the paper trail to prove these two
relationships!
- How fast are my match lists growing?
- I started out with 354 matches all dated 15 November 2013.
By 2 January 2016, I had only 333 matches with this
date. The other 21 must either have privatised their results
or had the date changed due to a need for reprocessing.
- My 666th match by date is dated 3 March 2015, suggesting
that the FTDNA Family Finder database was doubling in size
in just over 15 months.
- My 960th and most recent match at the time of compiling
these statistics was dated 26 December 2015 and my 480th was
dated 21 Jul 2014. This suggests that the growth rate had
slowed slightly, with the database now taking over 17 months
to double.
AncestryDNA
My AncestryDNA results arrived on 21 November 2015, just over two
years after my FamilyTreeDNA results.
To avoid the rip-off prices charged by AncestryDNA to non-U.S.
customers, I ordered the kit through a cousin based in the U.S. who
collected my sample on a visit to Ireland for Genetic Genealogy
Ireland 2015. I also had a gift of two kits from someone grateful
for the help I had given him with his DNA matches. A first cousin
used one of these, but it was rejected; I suspect that there may
have been too much lipstick mixed in with the saliva sample!
I appear in other people's AncestryDNA match lists as "P.W.
(administered by CWood91262)".
I am still struggling with the AncestryDNA interface. Other
users explained to me that the "Search matches" box starts to
function only after several weeks. Searching appears to be easier in
Google Chrome than in Mozilla Firefox. Unlike almost every other
internet search that I have used, the search results do not begin
with a count of the number of matching results.
To investigate the bizarre differences in shared cM figures and
match rankings between AncestryDNA and other sources, I copied my
AncestryDNA raw data to GEDmatch (A931453). I apologise to those who
fear that my appearing twice in their top 1500 GEDmatch matches may
move their most critical match from 1500th to 1501st place on their
list. I apologise also to those who feel that the costs imposed on
GEDmatch by processing my second kit outweight the benefits of the
additional understanding and confidence that I will gain by having
this second opinion. The top 6 matches for my two GEDmatch kits are
in the same order, but beyond that point the order is shuffled quite
a bit.
I started out with 61 pages of matches, with 50 matches per page
(apart from the last page), coming to 3046 matches in total, divided
into three groups:
- The first group of matches, headed "3RD COUSIN", contained a
single match, Anthea Ring. She was already my second top
match at FTDNA and my top match at GEDmatch, in both cases
ignoring close cousins for whose tests I had paid myself.
For Anthea, AncestryDNA says "Possible range: 3rd - 4th cousins"
and "Confidence: Extremely High"; FTDNA says "2nd Cousin - 4th
Cousin" and GEDmatch has Gen=3.4 (Total cM 133.3) for my FTDNA
kit but Gen=3.6 (Total cM 98.9) for my AncestryDNA kit.
- The second group of matches, headed "4TH COUSIN" contained 55
matches, all labelled "Possible range: 4th - 6th cousins".
For the top 13, Confidence was Extremely High; for the other 42,
Confidence was Very High.
- The third group of matches, headed "DISTANT COUSIN" contained
the remaining 2991 initial matches, all with:
Possible range: 5th - 8th cousins
The first 143 had Confidence: High.
The remainder had things like
Confidence: Good
and
Confidence: Moderate.
There were two Shared Ancestor Hints in my initial AncestryDNA
matches - two sisters who are my fourth cousins and who have our
common ancestors in their tree since I provided them with the
information after I found one of them on GEDmatch.
AncestryDNA's so-called "Shared Ancestor Hints" are often complete
nonsense that cannot even be dismissed. One example hinted that two women with the same
surname might be sisters despite their estimated birth years being
clearly shown as Abt. 1824 and ABT 1902. The fact that the estimated
birth years are presented inconsistently suggests that they are
completely ignored by the process which generates the hints.
I recognised my 301st initial match (Possible range: 5th - 8th
cousins; Confidence: Good; 10.5 centimorgans shared across 1 DNA
segment) as one of a group of siblings who are 19th, 28th, 29th and
30th on my FTDNA list, where they are estimated 3rd-5th cousins. The
one in 28th place is the one at Ancestry, but FTDNA says Longest
Block: 20.58cM.
AncestryDNA initially showed that I had no New Ancestor Discovery,
but this message later disappeared. The final message is "Currently,
you aren't in any Known Ancestor DNA Circles". I subsequently tried
unsuccessfully with two cousins to force a New Ancestor Discovery;
see facebook.com discussion.
I resisted putting a public family tree on Ancestry for as long as
possible, as I dread the prospect that the shaky-leaf-hint virus
which is rampant on that website will see my ancestors copied en
masse into the family trees of totally unrelated individuals.
Does the need to help my DNA matches outweigh the need to help those
likely to be misled by nonsense family trees that cite mine as a
source? I'm still not sure.
There have always been lots of shaky leaf hints on my own
AncestryDNA match list and family tree, most of them dubious, some
clearly spurious and a few downright nonsense. By 2020, these were
being labelled "Common ancestor" with the word "hint" completely
dropped. For some years, I had better things to do with my time than
making a detailed study of them, but eventually there were 19 such
matches and they had become so annoying that I tried to get rid of
them by adding new ancestors to my tree with "DEFINITELY NOT" in
their First and Middle Name and blank Last Name, marking these
ancestors as living so that my matches don't have to see the depths
to which I have been driven. There were 19 of these clearly wrong
hints, some suggesting new ancestors for me that couldn't possibly
be correct, others suggesting new ancestors for my matches. Here are
the links to the matches where the hints included new ancestors for
me, so that I (and anyone with whom I have shared my match list) can
check whether this strategy got rid of the so-called "Common
ancestors":
I would help any other suggestions for removing the nonsense hints.
Over the first couple of weeks following the initial publication of
my match list, I slowly found and identified a number of known
relatives among my matches, some with whom I had already been in
contact, others new:
- One new match on AncestryDNA made the
whole thing worthwhile. He is in second place on my list (39
centimorgans shared across 6 DNA segments), but not already at
FTDNA or GEDmatch. I had seen his tree at Ancestry before, but
had not contacted him as he had no information in his tree that
I didn't have, and Ancestry does not indicate which of its users
or which people in its user-submitted trees have submitted DNA
samples. We share a "great-aunt". In his case, she
is a well-documented great-aunt. In my case, she was
referred to by my mother as "Aunt Ellie", although she was not a
real aunt, but some sort of cousin. I've been trying for
40 years to establish the precise relationship. This is
one of the brick walls that I discuss in more detail in the introduction above. I had
recently convinced myself that I had enough evidence to prove
that my mother and her "Aunt Ellie" were actually second
cousins. This would mean that I am a third cousin once removed
of my DNA match. Ancestry says: Possible range: 4th - 6th
cousins; Confidence: Extremely High; Predicted relationship: 4th
Cousins; 39 centimorgans shared across 6 DNA segments.
Numerous subsequent attempts to establish contact with this
match have been unsuccessful. Watch this space to see whether
the DNA comparison confirms or refutes my theory.
- In 20th place on the list was someone whose tree I had
previously seen, with an ancestor from the same townland and
with the same surname as my mother. I have now satisfied myself
that we are fourth cousins. Ancestry says: Possible range:
4th - 6th cousins; Confidence: Very High; Predicted
relationship: 4th Cousins; 23.5 centimorgans shared across 2 DNA
segments.
- My 4th closest match at GEDmatch, again ignoring close cousins
for whose tests I had paid myself, has two Ancestry kits on the
same account, namely herself and her sister. They are
confirmed 4th cousins to me.
The sister who was my 4th closest match on GEDmatch is only
102nd on my ancestry match list (Possible range: 5th - 8th
cousins; Confidence: High; 14.9 centimorgans shared across 2 DNA
segments; dramatically different from 50.9 Total cM and 44.6
largest cM at GEDmatch).
The other sister shows as my 43rd closest match at Ancestry
(Possible range: 4th - 6th cousins; Confidence: Very High; 19.0
centimorgans shared across 3 DNA segments).
I requested the sister that I am in touch with to upload the
other sister's data to GEDmatch, which confirmed that I share
more DNA with the other sister - I share exactly the same 44.6cM
segment with both sisters, but a second segment of 17.4cM
with the second sister in place of a second segment of 6.3cM
with the first sister. When batch processing was completed, the
new kit naturally leapfrogged over her sister on my one-to-many
list to become the second closest match after the kits I paid
for myself.
- In 611th place on the list was a known 5th cousin, already
identifed with the help of FTDNA. I would not have recognised
him by his initials or found him in search results at Ancestry
if his son had not tipped me off. Ancestry says: Possible range:
5th - 8th cousins; Confidence: Good; Predicted relationship:
Distant Cousins; 8.2 centimorgans shared across 1 DNA segment.
- In 752nd place on the list (Predicted relationship: Distant
Cousins; Possible range: 5th - 8th cousins; Confidence: Good;
7.8 centimorgans shared across 2 DNA segments) was someone that
I long suspected was a half fourth cousin.
So I seemed to have no recognisable third cousin or closer who is a
customer of AncestryDNA, but six recognisable fifth cousins or
closer. Three of the six are more closely related to me than
Ancestry's possible range; the other three are related to me at the
closest end of the possible range.
Of the six known relatives located by this stage, none has a
complete conventional paper trail proving the person's relationship
to me beyond a reasonable doubt. Most involve a family secret of one
kind or another. The combination of conventional genealogical
evidence and DNA evidence has removed most of my doubts, but
until such time as all these matches have copied their results to
GEDmatch to allow matching segment searches and other advanced
analysis, some doubts will naturally remain.
Of the six matches:
- One represents a typical genealogical brick wall, where two
families remained friendly through several generations, but the
precise details of the relationship had been forgotten.
- Another represents another typical genealogical brick wall,
where two families with the same surname lived on adjoining
farms through several generations, but again the precise details
of the relationship had been forgotten.
- Two involved a fostering, where the child fostered knew his
birth parents' names and used his birth mother's surname, but
had no further contact with his birth parents (who later
married) after going to his foster parents.
- One involved a closed adoption, where the DNA trail identified
the birth parents more quickly that the information provided by
the adoption agency.
- One involved the mysterious, unsolved, and hushed up,
mid-nineteenth century disappearance of a man that I have long
thought of as `the wicked stepfather'.
Initial impressions are that FamilyTreeDNA undoubtedly overstates
the closeness of relationships on average, but AncestryDNA possibly
understates the closeness of relationships on average.
I immediately messaged my #2 match discussed above, and also the two
close matches that I share with Anthea, who appeared on my intial
list at #14 (28.7 centimorgans shared across 1 DNA segment) and #16
(25.1 centimorgans shared across 1 DNA segment). Both of these have
"No family tree" (public or private). Many months later, I was still
awaiting a response from either of these, neither of whom logs in
frequently.
Initial match #144 was tomgallagher2001, a name that appears in my
family tree, but "No family tree" attached to his DNA sample. I
checked his ancestry profile and found a seven-person public member
tree with no sources or documentation, going back to a Thomas William Gallagher, said to be born in
Culmore, Mayo, Ireland, which may be the same Cuilmore (one of four
in Mayo) in which my mother was born.
I have some technical difficulties with the AncestryDNA website:
- At the top of each page of matches, there is a "Search
matches" box. It expands to two boxes, one for Search by
surname, the other for Search by birth location. Using the
surname box to search for my own suname, my ancestral surnames,
surnames of my closest non-anonymous matches, etc., all returned
"No matches found" for the first couple of weeks after my
initial notification of results. Searching for birth locations
produces a drop-down menu from which the birth location must be
chosen. To get either Clare or Mayo, the two Irish counties
where most of my ancestry lies, to appear on this menu, requires
one to type Clare, Ireland or Mayo, Ireland in full, but typing
Limerick alone is sufficient to get Limerick, Ireland to appear.
One can get nonsense locations like Kilrush, Kildare,
Ireland (which is suggested to those trying to enter the much
larger but missing Kilrush, Clare, Ireland).
- The search for O' surnames appeared to be broken: I copied and
pasted the name O'Neil from my cousin (and match)
mbrowntexasboatworldcom's tree to the search box, ticked
"Include similar surnames" and got "No matches found". How can I
be sure that I am finding all my matches with my ancestral
surnames like O'Dea, O'Halloran, O'Neal, O'Neil or O'Neill in
their family trees?
- Firefox (inevitably for the first few days) and Chrome
(frequently) locked me into an infinite loop with this error
message while I browsed through my matches:
You must refresh your internet browser
Uh-oh. It looks like you caught us just after we rolled a site
upgrade. In order to continue, please refresh your internet
browser. We apologize for the inconvenience.
Refresh browser Cancel
So I was initially forced to struggle mostly with Safari and its
horrendous ignorance of basic Windows keyboard shortcuts and
clipboard practice.
- I had used Safari previously to log into a different Ancestry
account; several times it spontaneously transferred me back from
the account with my own results to the other account.
For the first couple of weeks, the Search matches box produced
precisely one hit from my 3046 matches. He has 8.8
centimorgans shared across 1 DNA segment. I had no matches born in
England or Australia, and only one when I searched by birth location
United States of America - the same one born in Ireland! After a
couple of weeks, the search function began to behave slightly
better. It still doesn't search by birth location in Irish counties,
but does return 17 pages of 50 hits for birth location in Ireland.
More usefully, search by surname also eventually began to give
sensible results. I quickly began to locate more known distant
relatives:
- There are seven results for Waldron, the first of them a third
cousin once removed, with whom I had previously been in contact.
Ancestry underestimates the closeness of our relationship:
Predicted relationship: Distant Cousins
Possible range: 5th - 8th cousins
Confidence: High
13.1 centimorgans shared across 2 DNA segments
- When I moved on to my paternal grandmother's surname McNamara,
I found a fourth cousin:
Predicted relationship: Distant Cousins
Possible range: 5th - 8th cousins
Confidence: Moderate
6.3 centimorgans shared across 1 DNA segment
- When I searched for variants of O'Neill, a surname which
appears in both my paternal and maternal ancestry, the matches
included an uncle and two nephews named O'Neill, but with a
connection through a Butler ancestor that makes them my double
half-tenth cousin and double half-tenth cousins once removed.
This connection is based on the assumption that the William
Massey named on the U.S. tombstone of his wife Ellen from
Ballylanders in County Limerick is the William Massy who sold
Glenville and died unmarried according to Burke's Irish Family
Records. The family tree cites as its main source "Ancestry
Family Trees", which always makes me highly suspicious that the
real source is the shaky-leaf hint virus. Even if Burke is
wrong, the shared DNA is likely to have come from some more
recent unidentified common ancestor, possibly either O'Neill or
Morley of Mayo.
- When I moved on to names which are common in my extended
family but are not the names of direct ancestors, I had more
success, and found another third cousin once removed:
Predicted relationship: Distant Cousins
Possible range: 5th - 8th cousins
Confidence: Good
7.9 centimorgans shared across 1 DNA segment
I soon realised that I needed to install the AncestryDNA Helper extension for the Chrome
browser.
The AncestryDNA Helper offered by Jeff Snavely can be added to
Google Chrome from the chrome web store by clicking the large blue
button and then the "Add extension" button.
The Helper/extension is then run by clicking on a new button at the
end of the address bar in Google Chrome.
The first recommended step is to click a SCAN button, which takes
over the computer for several hours (depending on connection speed
and processor speed) as it goes through all 64 (or however many)
pages of matches, first page-by-page, then match-by-match.
AncestryDNA seems to add several new matches every day. Inevitably
new known relatives began to crop up:
- 6 February 2016: A previously unknown fourth cousin, whose
grandfather and greatgrandfather appear in both of our family
trees.
Predicted relationship: Distant Cousins
Possible range: 5th - 8th cousins
Confidence: Good
9.1 centimorgans shared across 2 DNA segments
- 2 March 2016: A double third cousin once removed, whom I had
encouraged to consider submitting her DNA over two years
earlier; we discovered our second relationship only when
comparing DNA results..
Predicted relationship: 3rd Cousins
Possible range: 3rd - 4th cousins
Confidence: Extremely High
90 centimorgans shared across 5 DNA segments
- 20 March 2016: A fourth cousin once removed, who may have seen
my Facebook appeals for Clancy descendants to
submit DNA samples.
Predicted relationship: 4th Cousins
Possible range: 4th - 6th cousins
Confidence: Very High
20.4 centimorgans shared across 1 DNA segment
- 14 May 2016: A fourth cousin, whose first cousin was one of my
initial AncestryDNA discoveries:
Predicted relationship: 4th Cousins
Possible range: 4th - 6th cousins
Confidence: High
41 centimorgans shared across 4 DNA segments
- etc.
AncestryDNA also shows as matches some individuals who are not
matches using the default one-to-one settings at GEDmatch. Here are
some examples from amongst my own matches:
- A895750
AncestryDNA says:
Predicted relationship: Distant Cousins
Possible range: 5th - 8th cousins
Confidence: Moderate
5.0 centimorgans shared across 1 DNA segment
GEDmatch says:
Largest segment = 0.0 cM
Total of segments > 7 cM = 0.0 cM
(2036) No shared DNA segments found
- A601367
AncestryDNA says:
Predicted relationship: Distant Cousins
Possible range: 5th - 8th cousins
Confidence: Moderate
5.2 centimorgans shared across 1 DNA segment
GEDmatch says:
Largest segment = 0.0 cM
Total of segments > 7 cM = 0.0 cM
(2036) No shared DNA segments found
In such cases, reducing the default thresholds at GEDmatch will
normally pick up the match.
Being a project
administrator at FamilyTreeDNA made me wonder if there was an easy
way to share access to multiple AncestryDNA kits. I eventually
discovered this method.
What does it all mean?
- It was probably evident from Chapter 1
that, as a mathematician, I have been looking, so far almost
completely in vain, for a rigorous mathematical or statistical
model to aid my understanding of the science of genetics and
DNA.
- While possibly in danger of merely re-inventing the wheel, I
have tried to develop a simple mathematical and statistical
approach to the genealogical aspects that particularly interest
me.
- The next best thing to a mathematical or statistical model is
a graphical tool, and Family Tree DNA's chromosome browser is
just such a (multicoloured) graphical tool.
- However, it initially was a hindrance rather than an aid to my
understanding.
- And no sooner had I come to understand the chromosome browser
that it was rendered obsolete by the ADSA.
- So I have written the following sections to explain how the
light dawned for me.
Before looking at the chromosome browser,
we need a tiny bit of basic mathematics.
The mathematical relation R is said to be transitive if
VRW and WRZ imply VRZ.
For example, equals (=) is a transitive relation, since V=W and
W=Z imply V=Z.
Other simple mathematical examples of transitive relations are is
greater than (>), is less than (<) and is a subset of.
A mathematical example of a relation which is not transitive is
is not equal to. For example, 1 is not equal to 2 and 2 is not
equal to 1, but 1 is equal to 1.
More generally — verbally — is identical to is a transitive
relation, since V is identical to W and W is identical to Z imply
that V is identical to Z.
In genealogy, is related to is not a transitive relation, since
Tom is related to Dick and Dick is related to Harry do not
necessarily imply that Tom is related to Harry. Tom could be
related to Dick on Dick's paternal side and Dick related to Harry
on Dick's maternal side, in which case Tom is not related to
Harry. Or Tom, Dick and Harry could have a common ancestor (more
likely, a common ancestral couple, depending on whether they are
full-cousins or half-cousins) in which case Tom is related to
Harry. Or Dick could have some more remote ancestral couple for
whom one spouse is related to Tom and the other spouse is related
to Harry in which case again Tom is not related to Harry. I think
that takes care of all the possibilities. Some genealogists like
to talk about the concept of is connected to, which is a
transitive relation. (If X is related to Y and Y is related to Z,
then we say that X is connected to Z, regardless of whether X is
related to Z.)
Other simple genealogical examples of transitive relations are is
an ancestor of and is a descendant of.
As an aside, and speaking of ancestors versus ancestral couples,
it is surprising how much more common the former phrase is than
the latter in what I have read about DNA. If two cousins find a
significant half-identical region in their autosomal DNA, then
they can, with a bit of co-operation, work out which is the most
recent ancestral couple from whom they have both inherited the
relevant segment. At that stage, it is generally equally likely
that the segment was inherited from the husband in that couple as
from the wife. (Political correctness probably means that I should
call them male partner and female partner rather than husband and
wife!) Eventually, a more distant cousin sharing the same segment
may show up and reveal whether the segment came from the husband
or from the wife in the most recent ancestral couple of the first
two cousins. This only pushes the conundrum back another
generation or more, to the most recent ancestral couple shared by
all three cousins.
Transitive relations in genetic genealogy
The advantage of mathematics over the English language is its
lack of ambiguity.
Is matches a transitive relation? It depends on the sense in
which the word is used.
In many uses of the word matches, if V matches W and W matches Z,
then V matches Z, and so matches is (sometimes) a transitive
relation.
For example, if matches is used in the sense of is identical to,
then we have already seen that it is a transitive relation.
However, Family Tree DNA uses the word matches in the sense of is
related to, and we have already seen that then matches is clearly
NOT a transitive relation (even without the added complication
that in this case the relationship is probable rather than known).
Further confusion can arise, and certainly arose initially for
me, from the multiple uses of the verb match, with different
connotations, by Family Tree DNA and its users:
- explicitly, with the meaning that I have dubbed
FTDNA-overall-matches, on the Family
Finder
- Matches web page, where it clearly means is (probably)
related to, and is NOT a transitive relation; and
- implicitly, with the meaning that I have dubbed
region-matches, on the Family
Finder
- Chromosome Browser web page.
Equivalence relations in genetic genealogy
Genealogists are familiar with the extension of an is-related-to
type of relation to an is-connected-to type of relation.
Mathematicians in exactly the same way frequently extend a
mathematical relation to the equivalence relation
generated by the underlying mathematical relation.
Any equivalence relation divides the set of objects which it
compares into equivalence classes.
We can define such an is-related-to type of relation on the set
of all my FTDNA-overall-matches. Let's call this relation P (for
Paddy). We will say that WPZ if (a) W FTDNA-overall-matches both Z
and me and (b) Z FTDNA-overall-matches both W and me. This just
means that there is DNA evidence that W and Z may be related to
each other and to me.
Two people are in the same equivalence class of the corresponding
is-connected-to type of relation if it is possible to trace a path
from one to the other, but without going through me.
So if my siblings are not in the FTDNA database and my parents
are not related to each other and my parents have no relatives in
common who have tested, then my paternal relatives and my maternal
relatives will not end up in the same equivalence class.
Similarly, if none of my first cousins or their descendants are
in the FTDNA database and similar assumptions hold, then people
related to me through each of my four grandparents will end up in
four (or more) equivalence classes.
Many people believe that there are no more than six degrees of
separation between any two human beings, but I don't. I think the
world is much smaller than that. As one of my friends says, "there
are only 200 people in the world and the rest are an illusion
created with mirrors". It took me several decades of doing
genealogy to come up with a path from my father to my mother: a
cousin of my father and a cousin of my mother whose spouses were
uncle and niece. Within a couple of years, I had found a second
such path. There may well be such paths between your paternal
relatives and your maternal relatives in the FTDNA database, so
you may find that your FTDNA-overall-matches do not divide
naturally into equivalence classes like this at all.
DNAGEDCOM.com allows me to download an ??????_ICW.csv file (where
?????? represents my kit number) defining the is-related-to pairs
by which the relation P is generated. If I open this .csv file in
Microsoft Excel, then I can use the PivotTable tool to start
generating the is-connected-to relation which breaks my
FTDNA-overall-matches up into the equivalence classes of interest.
The next step is to use a few matrix multiplications to calculate
for each of my FTDNA-overall-matches how many of my other
FTDNA-overall-matches are within one, two, three, etc., degrees of
separation. Unfortunately, as I feared, having tried to use it
back around 2001 for handicapping racehorses, the MMULT function
in Microsoft Excel is still incredibly slow and inefficient in the
current version, even on my top-of-the-range 2012 laptop, so the
details will have to wait until I install some real software like
SciLab to do the job.
What I have discovered is that as of 10 Jan 2014 my 381
FTDNA-overall-matches included eight people each in equivalence
classes on their own, in other words eight people with whom I have
no ICW matches.
To users of FamilyTreeDNA.com, the word "matches" can also
sometimes mean region-matches.
Here's an example of what the FTDNA chromosome browser looks like
when comparing the logged-in kit to two other kits:
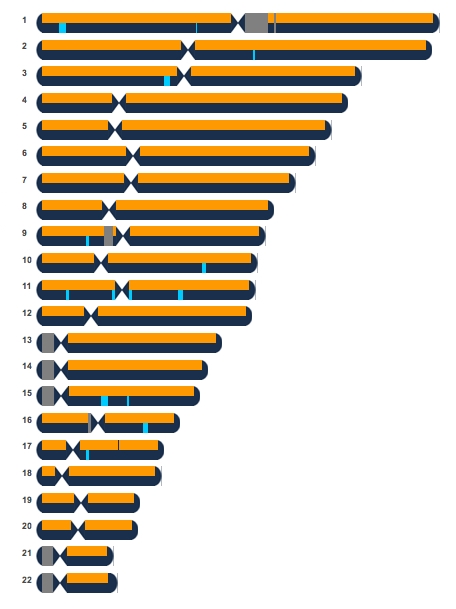
A maximum of five kits can be viewed simultaneously in the
chromosome browser. These can be selected by ticking boxes in one
of the worst designed selectors imaginable. To preserve the
anonymity of my FTDNA-overall-matches and to avoid shaming the
designer, I don't show it here. It is about 7.5 lines tall, but
shows one's FTDNA-overall-matches 10 at a time, ordered by
surname, necessitating a vertical scrollbar. It runs along to the
left of chromosomes 8 to 18, with plenty of blank white space to
the left of chromosomes 19 to X. Instead of showing the usual
colour-coded place-holders where no mugshots are available, it
shows grey mugshots for both males and females. My first
FTDNA-overall-match by surname is identified only by his or her
initials "N A". I have to go to another tab and search for his or
her colour-coded mugshot to determine whether this is a male or a
female, which is very significant when looking at the X
chromosome.
Someone I know through genealogy sent me the screenshot above
(taken before FTDNA added the X chromosome), generated while
logged in to her mother's FTDNA kit. Let's call her Terry. There
are lots more similar
examples
on
the ISOGG Wiki.
Terry and her mother have both tested with FTDNA and therefore
are, of course, FTDNA-overall-matches.
Terry's mother and I are also FTDNA-overall-matches. As discussed
on the FTDNA
facebook
page, we region-match on 14 regions of 1cM or more. Our
number of shared segments, longest block shared (8.93) and total
shared cM (38.24) combine to bring us in above the secret
threshold for FTDNA-overall-matches.
Terry and I are not FTDNA-overall-matches. For reasons that I
will come to later, we cannot see in the FTDNA data how much, or
which segments, Terry has inherited from her mother of the
autosomal DNA that her mother and I share, but we obviously expect
it to be about half. What matters for now is that Terry and I come
in below the threshold for FTDNA-overall-matches.
The blue regions in the image above are the 14 segments of 1cM or
more on which Terry's mother and I region-match; the original
default image showed only the 1 segment of 5cM or more on which we
region-match, but there is a dropdown menu which can be used to
reduce the threshold and display the smaller regions.
The orange regions in the image are those on which Terry and her
mother match: pretty much everywhere.
For my first couple of days looking at these pretty pictures in
the chromosome browser, I made the false assumption that
region-matches was a transitive relation, but this example shows
that it clearly isn't. If Terry region-matched me everywhere that
she region-matches her mother and that her mother region-matches
me, i.e. in all the blue segments in the chromosome browser, then
Terry would have to FTDNA-overall-match me, which she doesn't.
The next clue that I had misunderstood something was the fact
that Terry's DNA and her mother's DNA seem to match in 100% of
locations, but we expect to find that Terry inherited only 50% of
her DNA from her mother (one chromosome in each pair), and the
other 50% (the other chromosome in each pair) from her father. The
parent-child example in the
ISOGG wiki looks just the same as Terry's example, so I knew
there had to be a rational explanation.
I turned to Google in search of this explanation, and eventually
found a reference to half-identical
regions. Thinking that I might be on the right track, I
googled that phrase, which brought me to Lesson
9 of the Beginners
Guide
To Genetic Genealogy on the Wheaton
Surname Resources website, at which stage a light-bulb
finally went off in my head! I hope I have explained the concept
of half-identical region clearly above.
My initial confusion comes from the fact that there are 22 pairs
of chromosomes, but the chromosome browser appears to show only 22
single chromosomes.
Don Worth's Autosomal DNA Segment Analyzer (ADSA)
Why ADSA is great
I doubt I will ever again use FTDNA's chromosome browser, as it has
been completely blown out of the water by Don Worth's Autosomal DNA Segment
Analyzer released in January 2014. The documentation is here, a working
but fictitious sample output is here, and a
complimentary but somewhat confused blog post by Roberta Estes is here.
ADSA provides a nice graphical overview of your matches and
allows you to identify groups of people related to each other, and
in some areas to separate your paternal and maternal matches.
The FTDNA chromosome browser allows comparison of the logged-in
kit with up to five FTDNA-overall-matches. The ADSA automatically
compares all those with half-identical regions longer than the
selected cM threshold on each chromosome. I recommend thresholds
of 10cM and 1000 SNPs for beginners, but you will eventually want
to drop these thresholds to check whether relevant individuals
appear on particular chromosomes.
The FTDNA matrix
tool allows comparison of a selected group of up to ten of
the logged-in kit's FTDNA-overall-matches and shows which of the
selected group FTDNA-overall-match each other. The ADSA
automatically displays the equivalent matrix for 22 naturally
defined groups, one for each chromosome, comprising all my
FTDNA-overall-matches with half-identical regions longer than the
selected cM threshold on the relevant chromosome.
The FTDNA chromosome browser and matrix tool sort the people
being compared according to the probably arbitrary order in which
the user selected them. The ADSA very helpfully sorts the people
being compared by the starting location of the shared
half-identical region.
The pretty FTDNA chromosome browser pictures can only be shared
as screen-grabs. The even more colourful ADSA output is just a
single clever self-contained (admittedly large) HTML file, which
can be saved to disk and even shared as an e-mail attachment.
The FTDNA website breaks my FTDNA-overall-matches up into dozens
of web pages with 10 people on each. The ADSA displays all of them
on a single web page.
The FTDNA website displays ancestral surnames and locations with
horrible nested scroll bars. The ADSA displays the full string on
mouseover with no need for additional clicking (if your screen is
wide enough).
The ADSA uses data transferred by the user from FTDNA, so cannot
be used to view matches from the perspective of anyone other than
the kit owner.
Note that the ADSA displays anyone who region-matches the
kit-owner in more than one region of the same chromosome as if he
or she is two separate people (who sometimes appear not to even
FTDNA-overall-match each other).
How to use ADSA
- If you are not logged in at DNAgedcom.com, go to the login page and enter your DNAgedcom
Username and Password (which may not be the same as those for
the FamilyTreeDNA kit that you wish to analyse).
- Go to the download pageand enter the FamilyTreeDNA
Kit Number and Password for the kit that you wish to analyse,
hit the Get Data button, and wait. (Note that FTDNA turned off
download of ICW files around February 2017, so you may see
zeroes in the ICW Count column. This greatly reduces the
usefulness of the ADSA report as you will have to go to other
websites to check whether two kits which match the kit of
interest in the same region also match each other there, or
alternatively one matches the kit of interest on the paternal
side and the other matches it on the maternal side.)
- Go to the ADSA page, select whichever of your kits
you wish to analyse from the Kit number dropdown menu, and hit
the GET REPORT button.
The ADSA report will include whichever of your matches FTDNA had
processed before you last downloaded your match data from FTDNA to
DNAgedcom; you will want to repeat this download periodically.
My raw
autosomal results: homozygosity and heterozygosity
A chromosome, as shown in the chromosome browser, is essentially
an array of pairs of the four letters A, C, G and T.
This table shows the distribution of the paternal/maternal
unordered pairs in my raw autosomal results:
| paternal/maternal unordered pair |
No. |
| CC |
132111 |
| GG |
131631 |
| AA |
113797 |
| TT |
112998 |
| TC |
83322 |
| AG |
82671 |
| AC |
18129 |
| TG |
18011 |
| -- |
3501 |
| GC |
178 |
| CG |
168 |
| TA |
122 |
| AT |
113 |
| Grand Total |
696752 |
Lots of interesting things can be seen from this table:
- At 70.40% of all SNPs, I am homozygous, in other words the
letters observed from my paternal and maternal chromosomes are
the same (CC, GG, AA or TT).
- At 0.50% of all SNPs, no letters are observed and a missing
value code of -- is returned. Is this a form of measurement
error?
- The letters which pair together on the forward and reverse
strands of a single chromosome (AT or CG) almost never pair
together on the paternal and maternal chromosomes of a single
cell: at only 0.08% of SNPs are such pairs observed. Is this
another form of measurement error?
- At the remaining 29.01% of SNPs I am heterozygous, in other
words the letters observed from my paternal and maternal
chromosomes are different (TC, AG, AC or TG).
- Since the data is unphased, these four pairs are never
reported in the opposite order (no CT, GA, CA or GT).
- The letters which pair together on the forward and reverse
strands of a single chromosome are reported roughly equally
often in each order (GC and CG are both observed; TA and AT are
both observed). Is this also measurement error?
- The variation between people (at least between my parents) at
a SNP is almost never simply the reversal of the Watson-Crick
base pair between strands (e.g. GC for one person and CG for the
other), but usually involves different base pairs for each
person (e.g. GC or CG for one person and TA or AT for the other
person).
- While there are only 696,752 SNPs in my raw autosomal data,
there are 707,269 SNPs in the raw autosomal data for the second
person whose raw data I examined. Why the difference?
Note that at a typical (biallelic) SNP where I am heterozygous, I
am half-identical to everyone. For example, TC is half-identical
to CC, TT and TC. Hence, biallelic SNPs where I am heterozygous
provide no information in the search for half-identical regions.
On the other hand, at a biallelic SNP where I am homozygous, I am
not half-identical to anyone who is homozygous with the other
possible letter, i.e. where we are opposite homozygous. For example, if I am AA, I am
half-identical to those who are AG or AA, but not to those who are
GG. Thus the significance of a region where I am half-identical to
a stranger is determined not by the total number of SNPs in the
region, but by the number of SNPs in the region at which I am
homozygous. The more heterozygous SNPs I have in a region, the
more false positives will be expected to appear among those with
whom I am half-identical on that region.
The prevalence of homozygous SNPs varies markedly throughout my
genome. I have a spreadsheet in which I have compiled details of
281 regions on which I am half-identical to various people. The
proportion of SNPs at which I am homozygous in 280 of these
regions varies between 51.3% to 86.3%, with one small outlier
where I am homozygous at 74 of 75 SNPs. The mean proportion is
72.8%, which surprised me. I am homozygous at only 70.4% of all
SNPs, and expected homozygous SNPs to be under-represented in
regions where I am half-identical to others. The standard
deviation of the proportion is 6.6 percentage points.
Surprisingly, I have not yet found any comparison tool which
automatically reports either the number or percentage of
informative homozygous SNPs in a region of interest. For a region
on which two individuals are half-identical, any such comparison
tool should report the number of homozygous SNPs for each of the
two individuals. A comparison tool which does this is urgently
needed by all genetic genealogists.
genesis.GEDmatch.com began to address this problem by introducing
the concept of slimming,
which remains poorly documented, but has been discussed on a Facebook thread.
David
Pike's utilities report, inter alia, on runs or sequences of
consecutive homozygous and heterozygous SNPs. Here are summaries
for the first four kits to which I had access:
|
|
|
|
|
Longest sequence (SNPs) |
| Name |
%Heterozygous |
%Homozygous |
%NoCalls |
Total |
heterozygous |
homozygous |
| Paddy |
29.09% |
70.40% |
0.50% |
100.00% |
18 |
480 |
| Antoin |
29.34% |
70.31% |
0.35% |
100.00% |
18 |
720 |
| Mary |
29.35% |
70.05% |
0.60% |
100.00% |
23 |
428 |
| Anthea |
29.63% |
70.17% |
0.19% |
100.00% |
21 |
350 |
The extraordinary thing about this table is the difference
between the lengths of the longest sequences of heterozygous SNPs
and the longest sequence of homozygous SNPs. As there are more
homozygous SNPs than heterozygous SNPs, one would certainly expect
the longest homozygous sequence to be longer than the longest
heterozygous SNPs, but not more than ten times longer. Why is
this?
The data for my relatives does not appear to be unusual, as the
default settings for the two utilities are 20 SNPs and 200 SNPs
respectively.
Back to transitivity
Several words and phrases suggest themselves to describe the two
relations shown in the coloured regions in the FTDNA chromosome
browser:
- the relation between the reference person and the person
represented by one of the colours (an is-related-to type of
relation); and
- the relation between the people represented by two different
colours (an is-connected-to type of relation).
The words and phrases which spring to mind include:
- matches;
- shares a segment with;
- overlaps with; and
- is half-identical with.
For the first relation (that between the reference person and the
person represented by one of the colours) let's stick to the last
of these to make it completely unambiguous what we mean.
The first and most important thing to note is that, just like -
and for exactly the same reasons as - is related to, is
half-identical with is NOT a transitive relation. The person
represented by the orange segments may not be half-identical with
the person represented by the blue segments, even if the segments
overlap.
Suppose V and W share a half-identical region on, say, chromosome
11, and W and Z share a half-identical region starting at the same
location on chromosome 11. It does not follow that V and Z share a
half-identical region here. For example, V's first pair could be
AC, W's first pair could be CT, and Z's first pair could be GT
(which is not half-identical with AC). The same could be the case
at many other locations within the region.
In practice, this means that W inherited this segment of his (or
her) paternal chromosome from an ancestor shared with V but
inherited the corresponding segment of his maternal chromosome
from an ancestor shared with Z (or vice versa, maternal shared
with V and paternal shared with Z).
When W looks at V and Z together in the chromosome browser, there
will be an overlap of coloured regions in the relevant part of
chromosome 11.
When V looks at W and Z together in the chromosome browser, there
will be just one coloured region in the relevant part of
chromosome 11.
And when Z looks at V and W together in the chromosome browser,
there will be just one coloured region in the relevant part of
chromosome 11.
This assumes that each of the three individuals
FTDNA-overall-matches both of the other two; otherwise
FamilyTreeDNA.com does not allow them to do the comparisons in the
chromosome browser.
If V, W and Z in this example want to research effectively, it
appears that they will have to share their FamilyTreeDNA.com
passwords, so that each can compare the other two in the
chromosome browser. In Chapter 1, I have
already pointed out other circumstances in which sharing passwords
seems to be necessary for effective and productive research. It
would be nice if there were two levels of access to kits -
read-only guest access to allow this sort of chromosome browsing;
and full write access to allow changing of passwords, editing of
GEDCOMs, ancestral surnames, known relationships, etc., in much
the same way as online family trees published using systems such
as TNG
and even the much-maligned ancestry.com
allow different levels of access to different people.
On the FTDNA website, there are lots of routes from the Matches
page to the Chromosome
Browser page and to some of the data which the chromosome
browser displays.
For example, find the person you want to compare with on the
Matches page. Click the tiny dropdown just below his or her
mugshot (or missing mugshot icon). The Longest Block figure is
immediately revealed. Click the "Compare in Chromosome Browser"
link. (Repeat for up to five individuals.) Click the large blue
"compare" arrow. Now the number of Shared Segments between you and
each selected person is revealed along with the lovely colour
diagram.
I first found the following more circuitous alternative route:
click Family Finder, Chromosome Browser, Filter Matches By ...,
Name, [type name, don't hit <Enter> key], Find, checkbox.
Not yet having found the quick route to the Longest Block figure,
I thought I then had to View this data in a table and scan the
centiMorgans column for the largest value. The centiMorgans data
is shown to two decimal places in the table, but for some strange
reason trailing zeroes are omitted and the numbers are centred
instead of aligning on the decimal point, which doesn't make it
any easier to find the maximum by eyeballing the column.
Now it is time for a discussion of an important flaw in Family
Tree DNA's policy:
I can not use the Chromosome Browser to compare my DNA with that
of someone who is not one of my FTDNA-overall-matches, not even
with someone like Terry, who is the daughter of a match, and even
uses the same e-mail address for her own kit and for her mother's
kit. Likewise, I can not use the Chromosome Browser to compare my
DNA with that of a known relative who has tested but has not shown
up as an FTDNA-overall-match.
I don't see why any two consenting adult customers of Family Tree
DNA should not be allowed to compare their autosomal DNA in the
chromosome browser, but the company thinks differently, citing
unexplained "compliance with our matching and privacy policies"
when I raised this question on the company's
facebook
page.
Such comparisons must be done on third party websites, such as GEDmatch.com.
The next two chapters will each deal in some detail with a single
initial FTDNA-overall-match with whom I have had extensive
correspondence. In this chapter, I will include brief reviews of
two other groups of FTDNA-overall-matches whom I have not yet
contacted directly.
As already mentioned, my initial top ten FTDNA-overall-matches,
which are the same both by Relationship Range and by Longest
Block, include no less than five members of the Dengen family,
sharing an e-mail address - a mother and four of her children. (I
was bemused when I first looked at this in the small hours of the
morning and thought one of the sons was his father, with whom he
shares his name! I am still bemused that the father has two
Buckley lines, apparently from Cork and Tipperary, while I have
one Buckley line, from Kerry; I don't seem to have any surnames in
common with the mother, with whom I share DNA!) This is where the
Chromosome Browser seemed to come into its own. All five Dengens
are half-identical with me on the same large segment on chromosome
20 (27.96cM for the mother; 20.11cM or greater for the children).
As explained above, I cannot compare two
of the siblings to each other or compare mother and child in the
chromosome browser, so I cannot tell whether any pair of them are
half-identical in this segment. But because I know their
relationships to each other from their posted family trees, I know
that mother and each child must be half-identical in this segment.
Ex ante, I cannot tell whether any pair of siblings are
half-identical in this segment, but (I think) because all four are
half-identical with me, the chances that any two of them are
half-identical with each other become larger.
My Shared cM with the children is between 49% and 73% of my
Shared cM with the mother. The four siblings somehow have slightly
different lists of ancestral surnames - probably because
FamilyTreeDNA hasn't thought of allowing, or forcing, siblings who
share an e-mail address (and even those who don't) to also
automatically share their list of ancestral surnames. My
understanding is that the genetic process is an example of what
statisticians call a Markov process: whether or not any or
all of the four children have inherited this block of DNA from
their mother adds nothing further to what can be inferred about my
relation to the mother from the overlap between my DNA and hers.
So far, I have not discussed the crucial relationship between the
lengths of half-identical regions, sometimes expressed as
percentages of autosomal DNA shared by two individuals, and their
genealogical relationship.
This relationship provides a crude way of estimating the
genealogical relationship between two people whose autosomal DNA
has half-identical regions.
Everyone inherits exactly half of his or her autosomal DNA from
his or her father (22 paternal chromosomes) and the other half (22
maternal chromosomes) from his or her mother.
We have already seen that this implies that the regions where a
parent and a child are half-identical cover the whole of the 22
autosomal chromosomes.
Because recombination is random in nature, the proportion of DNA
inherited from grandparents and more distant ancestors becomes
random.
On average, we each inherit 25% of our autosomal DNA from each of
our four grandparents. Random variation means that some people,
for example, inherit 24% from their paternal grandfather and 26%
from their paternal grandmother; or 27.1% from maternal
grandfather and 22.9% from maternal grandmother; or even 32% from
paternal grandfather and only 18% from paternal grandmother. The
latter is a real example from GEDmatch, where the grandson is
A260081, the grandfather is A237206 and the grandmother is
A329975.
On average, siblings are fully identical on 25% of their
autosomal DNA (where they have inherited the same DNA from both
parents); they are half-identical on 50% of their autosomal DNA
(where they have inherited the same DNA from one parent, but
different DNA from the other parent); and they do not match at all
on 25% of their autosomal DNA (where they have inherited DNA from
different grandparents on both maternal and paternal sides).
The sibling relationship is special because siblings are related
on both the paternal and the maternal side.
The calculations are much easier for those who are related on
just one side.
Siblings are expected to share 50%, uncle-or-aunt/nephew-or-niece
25%, first cousins or
greatuncle--or-greataunt/greatnephew-or-greatniece 12.5% and so
on.
There are some nice pictures and tables which illustrate the
shared percentages, such as this one from the FTDNA
website:

This graph from 23AndMe shows why it is easy to exactly identify
close relationships but more difficult to be precise about
relationships beyond first cousins:
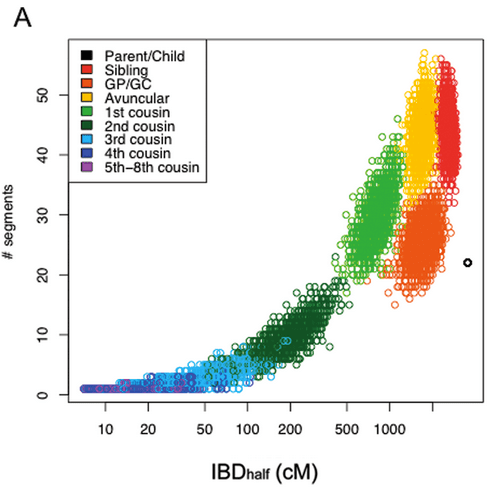
On 24 October 2015, Robert
James
Ligouri announced his Autosomal (atDNA) Prediction Grid. For
a given value of Total Shared cMs, this shows the range of
plausible full relationships (not considering the additional
possibility of a half-relationship).
This 50% principle can be quite difficult to grasp, as
illustrated by Roberta
Estes's
blog. The sort of loose language that Roberta occasionally
uses can lead to confusion. Thus she appears surprised to find
that almost 50% of short (in cM) segments of maternal (say) DNA
are inherited in their entirety by a child from a parent, and
almost 50% are not inherited at all by the child (who instead
inherits the corresponding paternal segment). In the limit, this
is like a coin toss, where almost 50% of the time the coin lands
head up, almost 50% of the time the coin lands tails up, and there
is a miniscule probability that the coin lands standing on its
edge.
At the opposite extreme, when results are aggregated over the
entire genome, the proportions of a child's maternal autosomes
that come from the maternal grandmother and from the maternal
grandfather are each expected to be 50%, and the standard
deviation around this figure is small.
For a large collection of short segments, it is of course
expected that half of the segments will be passed on to the child
and half will not. It is NOT expected that half of each individual
segment will be passed on. By definition of a centiMorgan, it is
expected that a 100cM segment will experience one crossover and
thus be passed on in two parts. In this sense, we could say that
segments longer than 100cM are expected break into more than two
parts, but segments shorter than 100cM are expected (on average)
to break into less than two parts.
When checking whether a small segment has been partially passed
on by a parent to a child or not passed on at all, it is important
to set both the cM and SNP filters low enough to pick up even
smaller segments. See Example III
below.
If the percentage of autosomal DNA shared by two people is 12.5%,
then other variables like age differences need to be considered in
working out the most likely relationship between them. Two men of
similar age sharing 12.5% are most likely first cousins, but if
their ages are a couple of generations apart they are more likely
to greatuncle and greatnephew.
How can we estimate the shared percentages from the observed
data?
The standard procedure appears to be to do this on the cM scale,
by adding up the lengths of any half-identical regions longer than
1cM. This overestimates the shared percentage by including
half-identical regions which are not half-identical by descent,
but underestimates the shared percentage by excluding
half-identical regions which are shorter than 1cM but are
half-identical by descent. It seems that these two biases cancel
each other out quite effectively.
If we have an unbiased estimate of the shared percentage between
W and Z and want to estimate the shared percentage between W and
one of Z's parents whose DNA is unavailable, say V (the one on
whose side the relationship is), what can we do? Since Z got half
of her DNA from V, we just double the estimate. But what about
half-identical regions between 0.5cM and 1cM which are not counted
when comparing W and Z, but which are expected to come from
half-identical regions of between 1cM and 2cM shared by W and V?
Do we need to use a factor slightly greater than 2.0 to take
account of these regions?
Similarly, if we have separate estimates of the shared
percentages between B and the siblings D, E and F, we can get a
more precise estimate of the shared percentage between B and the
parent of the sibling group who is related to B, say H, by
doubling the figures for D, E and F and then taking the average of
the three results.
The method of doubling the shared percentage appears to work fine
until the result is greater than 50% or even 100%. By the time
that stage is reached, in theory the analysis has gone back beyond
the common ancestor, possibly by taking a wrong turn somewhere
along the road. In practice, however, the shared segments that are
detected are precisely those that are longer than expected, so
implied shared percentages greater than 50% or even 100% are
likely to be encountered even in a correct lineage.
In fact, beyond a common ancestor, a halving principle replaces
the doubling principle. Suppose I share 23% of my DNA with one of
my grandfathers (slightly less than the expected 25%). Given this
information, I am expected to share 11.5% of my DNA with each of
his parents (slightly less than the prior expectation of 12.5%).
If you are an adoptee, or even a foundling, or for some other
reason have doubts about your parentage or paternity, then DNA can
be a big help. In summary:
- If you are male, then:
-
- you have Y-DNA which you definitely share in its entirety
with your patrilineal ancestors (father, father's father,
etc.) and with anyone else with the same patrilineal
ancestors;
- you have X-DNA which you potentially share with some of
your maternal ancestors (mother, both of mother's parents,
three of mother's grandparents, etc.) and with anyone else
with the same X ancestors;
- you have mitochondrial DNA which you definitely share in
its entirety with your matrilineal ancestors (mother,
mother's mother, etc.) and with anyone else with the same
matrilineal ancestors; and
- you have autosomal DNA which you potentially share with
all of your maternal and paternal ancestors and all of your
cousins.
Also:
-
- anyone with whom you share Y-DNA is related to you through
your father;
- anyone with whom you share X-DNA is related to you through
your mother;
- anyone with whom you share mitochondrial DNA is related to
you through your mother; but
- it is impossible to tell on which side (your paternal or
maternal sides) someone with whom you share autosomal DNA
only is related to you.
- If you are female, then:
-
- you have X-DNA which you potentially share with some of
your maternal ancestors (mother, both of mother's parents,
three of mother's grandparents, etc.) and with some (but
fewer) of your paternal ancestors (father, paternal
grandmother, father's maternal grandparents, etc.) and with
anyone else with the same X ancestors;
- you have mitochondrial DNA which you definitely share in
its entirety with your matrilineal ancestors (mother,
mother's mother, etc.) and with anyone else with the same
matrilineal ancestors; and
- you have autosomal DNA which you potentially share with
all of your maternal and paternal ancestors and all of your
cousins.
Also:
- anyone with whom you share mitochondrial DNA is related to
you through your mother; but
- it is impossible to tell on which side (your paternal or
maternal sides) someone with whom you share autosomal DNA
only or X-DNA is related to you.
If you know who your mother is, but don't know who your father
is, then DNA can also help, particularly if your mother has other
children who are willing to provide DNA samples. Your mother's
other children will be either:
- your full-siblings, in which case you can expect to be
half-identical to them on 75% of the length of the autosomes or
approximately 2538cM; or
- your half-siblings, in which case you can expect to be
half-identical to them on 50% of the length of the autosomes or
approximately 1692cM.
These are just expected values; actual values will be distributed
around these averages. The standard deviations are poorly
documented but there is an online
spreadsheet showing a small sample of comparisons. The
percentages seem to be calculated differently in this spreadsheet
(can someone please explain?), but the maximum shared percentage
observed for half-siblings is much smaller than the minimum shared
percentage observed for full-siblings. In other words, this test
can unambiguously distinguish between half-siblings and
full-siblings.
Anyone who shares half-identical regions of autosomal DNA
(particularly overlapping regions) with two half-siblings (or two
groups of half-siblings) with the same mother is unlikely to be
related to the father of either group.
My FTDNA-overall-matches include two people whose GEDCOMs
suggest, with various caveats, that they may be sixth cousins,
namely Charles (with whom I share 38.19cM) and Janice (27.90cM),
and also Janice's nephew Walter (29.39cM).
Note that I share more with the nephew than with the aunt!
Walter's father must have inherited much more than expected and
Janice inherited much less than expected from their mother. My
implied shared cM with Walter's father, calculated by doubling my
shared cM with Walter, is 58.78. Similarly, my shared cM with
Janice's mother, calculated by adding (averaging, then doubling)
the shared cM figures for two of her children (one figure directly
observed, the other inferred from his father's figure) is 86.68.
Ultimately, my implied shared cM with their common ancestral
couple, Christopher Choate and his wife, calculated by doubling
the shared cM figures back to the common ancestor and then
averaging, and subject to the aforementioned caveats, is 5217.92cM
or 77.1%, which is implausible. One of my five closest
FTDNA-overall-matches (who submitted his DNA after I did and whose
shared cM with me 49.36) is also a Choate and shares an e-mail
address with Walter. Unfortunately Walter has not yet uploaded a
GEDCOM for this latest member of his immediate family to give a
DNA sample, so I have no idea where to incorporate the new person
into this calculation. He has listed the new person's Most Distant
Paternal Ancestors as "James Choate b.1813 TN m. Elmira Farmer
b.1816 MO".
I was not surprised when I checked the chromosome browser and
found that I share the same half-identical region on Chromosome 9
with all four of these people. The half-identical region which I
share with Janice is 9.76Mb or 12.69cM or 2477 SNPs long, and is
contained within the even longer half-identical regions which I
share with the other three. There seems little doubt, given the
additional genealogical evidence, that all four of them have
inherited this segment from Christopher Choate or his wife.
Christopher is said to have been born in Maryland in 1720, so at
first seemed very unlikely to have descendants in Ireland, where
all my known ancestors back to 1720 have lived. There is certainly
no mention of Ireland in the extensive Choate pedigree on genforum.
However, another Choate
pedigree says that Thomas Choate, one of Christopher's many
American-born sons, married in Ireland. In the complete absence of
genealogical evidence to link me to his descendants, it could of
course be that I am merely half-identical by chance with
Christopher or his wife in the relevant region of chromosome 9,
and thus that I am also half-identical by chance with many of
their descendants who have inherited the relevant segment from one
of them, including these four FTDNA customers. Or perhaps the
caveats in the GEDCOMs are correct, and all these people are
descended from their daughter-in-law, the woman whom Thomas Choate
married in Ireland.
Two more people FTDNA-overall-match myself and the four Choate
descendants and share half-identical regions with me overlapping
with that on chromosome 9 that I share with Janice and the others.
GEDmatch.com has no less than 17 kits with which I am
half-identical on the same segment as with Janice, including
Janice herself and Walter again, three other FTDNA kits and twelve
23AndMe kits. I have not yet tried to trace any of them back to
Christopher Choate and his wife. Some of them may be
half-identical with the Choate descendants, some of them may be
related to me on the opposite side from the Choates (paternal or
maternal), and some of them may again be half-identical purely by
chance.
Phasing and
Triangulation
Triangulation and phasing are really opposite
sides of the same coin. If V is half-identical on the same
region with W and Z, then there are two possibilities:
- W and Z are half-identical to each other on this region, in
which case V, W and Z probably inherited an identical segment in
this region from a single common ancestor and the relationship
can be described as triangulated;
or
- W and Z are not
half-identical to each other on this region, in which case V is
probably related to W on V's paternal side and V is probably
related to Z on V's maternal side, or vice versa, and V's autosomal DNA in this
region can be phased.
I use the word 'probably' for two reasons:
- because it is always possible than one or more of the pairs
are merely half-identical by chance, particularly if the number
of SNPs observed in the region at which the parties are mutually
homozygous is small; and
- because each may share an identical segment with one of the
other two on the paternal side and with the third person on the
maternal side.
To give a concrete example, when I think of a triangular
relationship, I always think about my GGGgrandfather Parker's
brother and my GGGgrandmother Keas's sister who married the two
Smith siblings. They produced three families, each of which were
first cousins to the other two, but who didn't have a single
common ancestral couple! If one took DNA from one member of each
of these three families, two Parkers and a Smith, then each of
them as first cousins would share many half-identical regions
with both of the others. There would be some regions in which
the two Parkers had an identical segment from a Parker
grandparent, one of the Parkers and the Smith would have an
identical segment from a Smith grandparent, and the other Parker
and the Smith would have an identical segment from a Keas
grandparent. In this example, the three cousins will all "match"
each other genetically, but on closer examination it will be
found that there is no common ancestral couple of all three.
This is the very opposite to what "triangulate" usually means to
genetic genealogists and thus, possibly for these purely
personal reasons, I dislike the word triangulate.
I further dislike the word triangulate because it is used
ambiguously, often being used also in the context of
FTDNA-overall-matches as well as in this context of
region-matches. In the case of FTDNA-overall-matches, the logic is
also that if three people each FTDNA-overall-match the other two,
then it is more likely
that all three share a common ancestor. While this triangulation
argument makes a common ancestor more likely, it does not
definitively prove that one exists, as each pair may share
completely different half-identical regions coming from three
different common ancestral couples.
Furthermore, a triangle has three sides, but in the case of
region-matches FTDNA continues to effectively insist on displaying
just two sides of the triangle - I can see my half-identical
regions with two of my FTDNA-overall-matches, but without asking
one of them to look in the chromosome
browser or ADSA or GEDmatch
or to join a project which I administer, I cannot tell whether
they are half-identical with each other in a region where both are
half-identical with me, or alternatively appear to be related to
me on opposite sides (one paternal, the other maternal).
While the word triangulation suggests that inferences can be
drawn and even that proofs can be established based on groups of
three people, who may only be FTDNA-overall-matches, in fact one
needs to look at groups of four people, who must region-match on
the same region, to draw truly valuable inferences. If three
people region-match you on the same region, then either all three
share your paternal segment on that region, or all three share
your maternal segment on that region, or two share one segment and
one shares the other. In other words, at least three of the four
people have an identical segment. Now it will be much easier to
make progress.
This all assumes that the half-identical regions in question
contain enough SNPs that they are not merely half-identical by
chance. If you find two people with whom you are half-identical on
the same region, there are really three possible explanations:
- the other two people are half-identical to each other on the
region and all three share a common ancestral couple;
- the other two people are not half-identical to each other on
the region, one shares a common ancestral couple with you on
your father's side and the other shares a common ancestral
couple with you on your mother's side; or
- the other two people are not half-identical to each other on
the region, and at least one of them is only half-identical by
chance to you on the region.
In the second of these cases, it can be deduced that at any
biallelic SNP where the other two people don't match (i.e. are opposite homozygous), you are
heterozygous (since you match both). Furthermore, if you know
which is the paternal match and which is the maternal match, then
you can deduce which letter came from your father and which from
your mother at that SNP. For example, if you are AG, the paternal
match is AA and the maternal match is GG, then your A must have
come from your father and your G from your mother. Even if you
don't know which is the paternal match and which is the maternal
match (e.g. if you are an adoptee), you can still draw valuable
inferences. For example, if both matches have ancestral surnames
and/or ancestral places which crop up repeatedly among your
matches, then you can phase the surnames and places into two
groups, one associated with each parent. Such an analysis between
Anthea (an adoptee) and myself and Michael (who both match Anthea
on the same region on Chromosome 4 but don't match each other)
provided strong evidence that Anthea's many matches from Connemara
are probably through the parent related to Michael, and that her
many matches from east Mayo are probably through her other parent,
the one related to me.
Another word of caution (which still applies to this last
example): if the region in question is shorter than 20cM, then it
is not sufficient to check whether the two people are
FTDNA-overall-matches or even to check whether ADSA shows that
they match in the region of interest. It could be that they are
half-identical on the region of interest, but don't meet the 20cM
overall Shared cM criterion to be deemed FTDNA-overall-matches. It
is essential to copy both parties' raw data to GEDmatch.com and to
run a one-to-one comparison between them there. This has not yet
been done in this example. It is also advisable to set the cM
threshold for the one-to-one comparison at GEDmatch.com much lower
than the length of the region of interest, since it is well-known
that half-identical regions have fuzzy boundaries. Many people
argue that the word 'triangulate' should never be used when
discussing ICW matches unless all three have been shown to be
half-identical to one another on the same region of a particular
chromosome.
Here is another interesting example combining triangulation and
phasing:
| Kit1 |
Kit2 |
Chr |
Start Location |
End Location |
Centimorgans (cM) |
SNPs |
| F310654 |
F335391 |
6 |
9,024,323 |
37,698,281 |
35.8 |
13187 |
| F310654 |
M090954 |
6 |
25,059,788 |
32,851,195 |
3.5 |
6272 |
| F310841 |
M090954 |
6 |
25,790,241 |
33,593,237 |
3.2 |
6849 |
| F310654 |
F310841 |
6 |
25,988,473 |
32,851,195 |
2.2 |
6052 |
| F335391 |
M090954 |
6 |
29,194,808 |
32,795,951 |
1.5 |
4338 |
| F310841 |
F335391 |
6 |
29,194,808 |
32,795,951 |
1.5 |
4443 |
The above table shows six half-identical regions between four
individuals: each is half-identical to the other three, at a
minimum at 4,338 consecutive SNPs between locations 29,194,808 and
32,795,951 on Chromosome 6. Note that this example deals with
a region with a very high SNP/cM ratio. (Ann Turner has written a
paper about this strange region on chromosome 6.)
As the cM lengths of the half-identical regions are small, the
most recent common ancestors (apart from for the known first
cousins with a half-identical region of 35.8cM) are probably very
distant.
F310654 and F335391 in the first row are known first cousins on
F310654's maternal side. M090954 is half-identical to both of them
between locations 29,194,808 and 32,795,951, so must also match
F310654's maternal chromosome between these locations, and the
same applies to F310841. So we can claim successful triangulation
(or even quadrangulation) in this region.
However, between locations 25,988,473 and 29,194,808 both M090954
and F310841 are half-identical to F310654, but not to F335391. Now
we can claim successful phasing in this region: it is safe to
assume that F335391 matches F310654's maternal chromosome in this
region, since they are known first cousins. Hence, M090954 and
F310841 must match F310654's paternal chromosome in this region.
Now the question arises as to whether M090954 and F310841 also
match F310654's paternal chromosome in the adjoining region
between locations 29,194,808 and 32,795,951. One way of checking
this is to look at the colour-coded graphic bars in the
GEDmatch.Com Autosomal Comparison:
| Base Pairs with Full Match = |
|
| Base Pairs with Half Match = |
|
| Match with Phased data = |
|
| Base Pairs with No Match = |
|
| Base Pairs not included in comparison = |
|
| |
| Matching segments greater than 1 centiMorgans =
|
|
| Centromere |
|
The following table shows the output for F310654 and M090954:
| Chr |
Start Location |
End Location |
Centimorgans (cM) |
SNPs |
| 6 |
25059788 |
32851195 |
3.5 |
6272 |
Chr 6


Image size reduction: 1/46
The following table shows the output for F310654 and F310841:
| Chr |
Start Location |
End Location |
Centimorgans (cM) |
SNPs |
| 6 |
25988473 |
32851195 |
2.2 |
6052 |
Chr 6


Image size reduction: 1/46
In both cases, the output makes it clear that there are
subregions (coloured green) where each of the other parties match
both F310654's paternal chromosome and F310654's maternal
chromosome. It would be necessary to inspect raw data to identify
the overlapping segments more precisely.
F310654 and M090954 are believed to be fourth cousins twice
removed on F310654's paternal side, but the half-identical region
of 3.5cM considered here may be from a more distant common
ancestor than this known relationship.
Triangulation groups
The ultimate objective is to collect DNA matches into triangulation groups. A
triangulation group is a set of three or more people who are all
half-identical to each of the other group members on overlapping
regions.
Here is an example from Chromosome 9:
9 106,881,785 124,347,952 24.0 4,938 Hincken/Morrissey
9 114,714,102 132,034,981 24.4 4,397 Quinn/Hincken
9 114,714,102 125,890,734 15.7 2,999 Morrissey/Quinn
All three members of the triangulation group are half-identical
to each other from 114,714,102 to 124,347,952. The interpolator can be used to confirm that the
(sex-averaged) length of this overlap region is approximately
13.7cM:
| Chr |
Query (bp) |
Sex-averaged (Kos cM) |
Female (Kos cM) |
Male (Kos cM) |
| 9 |
114714102 |
118.8510593879110 |
147.9192814455530 |
91.1703069169749 |
| 9 |
124347952 |
132.5099030861300 |
164.5840116062510 |
101.8401906721300 |
This region is long enough that it almost certainly contains a
DNA segment inherited by all the members of the triangulation
group from a relatively recent single common ancestor.
A triangulation group including at least one subgroup who are
known relatives is of particular use. In the above example,
Hincken and Quinn are known third cousins, with most recent common
ancestral couple Denis O'Connell (died 1887 aged 90) and Kate
O'Dea (died 1889 aged 78). It can then be concluded that the other
members of the triangulation group are related to one of the most
recent common ancestral couple of the known relatives, or even
descended from both. In this case, we can infer that Morrissey is
related to either Denis O'Connell or Kate O'Dea. The total amount
of shared DNA will indicate whether the most recent common
ancestor of the entire triangulation group is upstream or
downstream from the known most common ancestral couple of the
known relatives. In this case, Morrissey has known ancestry from
the same townland as the others, so geographic evidence added to
genetic evidence points in a very specific direction.
As half-identical regions have fuzzy boundaries, it is rare to find
that even two of the half-identical regions in a triangulation group
share either the same beginning or ending location. In the example
above, there is just one boundary location (114,714,102) common to
two of the three half-identical regions. One should concentrate on
looking for overlaps rather than exact shared boundaries, which have
no special significance.
If a triangulation group contains two subgroups of known
relatives, then it can be concluded that one of the most recent
common ancestral couple of the first subgroup is related to one of
the most recent common ancestral couple of the second subgroup
This question from IGP's County Clare Ireland Genealogy Group
on Facebook illustrates some of the factors to bear in mind when
looking at possible triangulation groups:
This is the diagram of chromosome 14 for five of my DNA
matches. The first two are first cousins to one another and my
third cousins. We three are descended from our ggg grandparents
from Clare or Galway. The last match shares their surname. Are we
all likely to be related through that line?
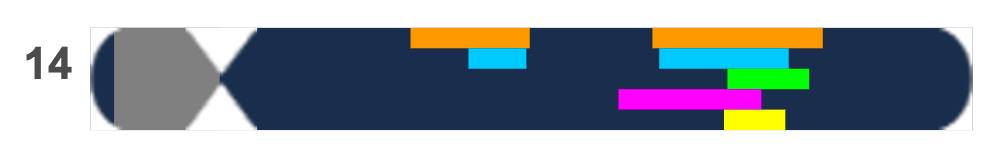
In theory, some
of these five FTDNA-overall-matches could match the
questioner's paternal chromosome 14 and others match
her maternal chromosome 14. In practice, something
like this usually does turn out to be a genuine
triangulation group. It is necessary to look at all 15
one-to-one comparisons
between the six people in order to confirm that each
is half-identical to the other five on the overlap,
and thus that there is a DNA segment which all six
have inherited from a shared common ancestor. The
easiest way to do this is to have all six people at
GEDmatch. If five of the six can be seen at FTDNA,
either by having the passwords or by administering a
project to which they belong, then one can check
that way. One can also get a good indicator from the
ADSA which will
show which of these kits are FTDNA-overall-matches
to each other. This does not prove that they are
half-identical to each other on this particular
region: one could be related to the questioner's
father but have a second relationship through a
different common ancestral couple to those who are
related to her mother. The DNA match still doesn't
prove who the common ancestor was, but one can be
virtually certain in this case that the shared DNA
came through one of the known shared GGgrandparents
of three members of the triangulation group.
The
likelihood that it came through a common ancestor
with the shared surname depends on various other
factors:
- how
common is the surname?
- did the
most distant ancestors with the same surname live
near each other?
- is there
any other shared surname between members of the
triangulation group?
- does the
total shared DNA indicate that the person sharing
the surname is a third cousin or closer?
- can you
add a known relative of the person sharing the
surname to the triangulation group?
Pile-up regions and pile-up groups
It doesn't take long to notice in the ADSA or Matching Segment
Search output that there are regions where one isn't half-identical
to anyone else and other regions where one is half-identical to
dozens of people. The term pile-up
region is used to describe the latter.
If the kits in a pile-up region are all half-identical to each
other, as is generally the case, then one has a very large
triangulation group, which could be called a pile-up group.
Pile-up regions and pile-up groups still seem to be poorly
understood in general, but many potential causes can be put forward
for their prevalence:
- the centiMorgan scale may have been badly estimated and may
exaggerate the length of these regions;
- these may be regions where the DNA subject has long runs of
heterozygosity, which result in him or her matching almost
everyone else;
- many of the SNPs observed in these regions may exhibit very
little variation, with the vast majority of humans having the
more common letter;
- the members of the apparent pile-up group may actually include
many close relatives, or even duplicate kits;
- etc.
Depending on which of these is the cause of the particular pile-up
region, the members of the associated pile-up group may:
- have a shared DNA segment inherited from a very distant common
ancestor, much further back in time than would normally be
inferred from the centiMorgan length of the shared segment
alone; or
- be merely half-identical by chance to
each other.
You may find subgroups of known relatives within a pile-up group,
but even these should be treated with caution. In a small
triangulation group containing known relatives, one can be very
confident that the shared DNA segment was inherited by the known
relatives from one of their known most recent common ancestral
couple, and that the other member of the triangulation group are
also related to that common ancestor. One's confidence in this
conclusion will be reduced:
- the more members the triangulation group has (in other words
if it appears to be a pile-up group);
- the more distant the known relationship;
- the less complete the known pedigree charts of the DNA
matches; and
- the shorter the centiMorgan length of the apparent shared DNA
segment.
It sometimes transpires that members of a pile-up group are
distantly related in multiple ways. Five kits that I uploaded to
GEDmatch (plus many other kits) constitute one such pile-up group,
the members of which are all half-identical to each other on the
same region of Chromosome 18 between locations 8,654,894 and
11,072,818.
I first spoke about this region as Example IX in my talk
at Genetic Genealogy Ireland 2016.
This region is 8.1cM long according to the Rutgers
Map Interpolator and contains 1,016 SNPs which appear in the
raw data for one or more of the five kits. Either these five
individuals all inherited a DNA segment from a shared common
ancestor of all five, or one or more of them is half-identical by
chance to all of the others, probably half-identical by chance to
the common segment inherited by all of the others.
We will call the DNA subjects whose data I uploaded Jack, JJ, Mary,
Paddy (i.e. myself) and Tom. All five of us have at least one grandparent
born within a radius of about three miles of each other in County
Clare. There are three known relationships within this group:
- Jack's father is related to JJ's father (doubly so, as JJ's
relevant paternal greatgrandparents were cousins);
- Paddy's father's mother is related to Mary's mother; and
- Mary's father is related to Tom's father.
The "Are your parents related?" tool at GEDmatch.com says "No
indication that your parents are related" for each of the five kits.
In other words, none of the five subjects has an unusually long run
of homozygosity throughout this region (or any other region), so
only one parent of each had the shared DNA segment. If the
relevant segment comes from a common ancestor of all five, it
must come to Mary either through her father or through her mother,
but not both, so either Paddy or Tom must be doubly related to Mary,
the hitherto unknown second relationship being revealed by the DNA
analysis.
There is a sixth member of this triangulation group (Joe), who
matches the other five only on the last 3.3cM, but whose raw data I
do not have access to. In fact, Joe was the second of the group,
after myself, to upload to GEDmatch. I was thrilled when I found
that I matched Joe here, as we both have Kett ancestors (from
opposite ends of County Clare), and I had long suspected that the
two Kett families were related. Joe's mother shares this unusual
surname (Kett) with an ancestor of Paddy's father's father, so the
original hypothesis was that the shared DNA came from a common Kett
ancestor, whether Mr. Kett or Mrs. Kett to be determined. I even
mentioned this when asked to speak at the unveiling of a monument to
a long-dead member of the Kett family in April 2016.
I was even more excited when I got JJ's results and uploaded them to
GEDmatch. JJ's mother was also a Kett, making JJ and Joe fourth
cousins with their most recent common ancestral couple being their
common Kett GGGgrandparents John Kett and Mary O'Connell. When the
three of us triangulated on this region, it made the Kett hypothesis
seem far more likely.
Things began to fall apart when Mary uploaded to GEDmatch and she
turned out to also be part of the triangulation group. The Kett
hypothesis became unlikely when it became clear that the shared
segment was far more likely to have come through Paddy's father's
mother (Mary's half-aunt) than through a Kett ancestor to Paddy's
father's father (no known relation to Mary). So it turned out that
this wasn't a Kett link on my side at all, but it could still have
come to JJ and Joe through their common Kett ancestors.
However, the Kett hypothesis was finally and completely blown out of
the water when Jack uploaded to GEDmatch. He also fitted into the
triangulation group and now it became clear that the shared segment
was far more likely to have come through JJ's father (Jack's second
cousin) than through a Kett ancestor to JJ's mother (no known
relation to Jack). It now appeared that Joe is related to both of
JJ's parents and that this wasn't a Kett link on Joe's side either.
Again, the hitherto unknown second relationship was revealed by the
DNA analysis.
Finally, Tom came along, and cast doubt on whether this segment came
to Mary through her father (in which case Paddy must be doubly
related to Mary) or through her mother (in which case Tom must be
doubly related to Mary).
I suspect that the centiMorgan length of this region is
overestimated and that we all do have a common ancestor from whom we
have inherited parts of it, but that the common ancestor is many
generations further back that the lengths of the individual
overlapping half-identical regions (averaging 18.6cM) initially
suggested.
To explore further, I extracted the relevant 1,016 rows from the raw
data file of each of the five subjects into a spreadsheet and did
some additional analysis.
The following observations may be of interest:
- there are 36 locations out of the 1,016 where all five
subjects are heterozygous and the letter inherited in the common
segment cannot be inferred;
- there are 55 locations out of the 1,016 where one or more of
the five subjects has a missing observation;
- Tom (CC) is opposite homozygous to Jack and JJ (AA) at the
terminal location 11,072,818, but all five kits are mutually
half-identical at the initial location 8,654,894 (i.e. the two
endpoints are treated differently when GEDmatch reports
half-identical regions - the subjects are half-identical at the
start location, but are not half-identical at the end location);
- at the remaining 924 locations out of the 1,016, the letter
inherited from the common ancestor can be inferred uniquely (as
GEDmatch does for Lazarus kits);
- there are 311 locations out of the 1,016 where all five
individuals are homozygous (i.e. monoallelic locations within
the group of five);
- there are 650 biallelic locations;
- there is no triallelic location; and
- of the remaining 55 partially missing locations, 22 are
biallelic, 32 are monoallelic and 1 is missing for all five
individuals.
If my own overall percentage of homozygous locations (70.40%) was
representative, then we would expect five individuals to all be
homozygous at 17.29% (=70.40%^5) of locations; the
observed 30.64% (311/1015) of locations where all five are
homozygous is much higher than anticipated. So the most plausible of
the above explanations for the pile-up in this particular case is
that there is less variation than normal in this region, at least in
the relevant population.
The biallelic and monoallelic locations seem fairly uniformly spread
along the region - the autocorrelation of the relevant binary
variable (indicating whether a location is biallelic or monoallelic)
is only around 15%.
I have already noted that pile-up regions still seem to be poorly
understood in general, and this example is only a start in trying to
get a feel for exactly how they arise. The mystery is likely to
remain unresolved until we have improved measures of the significance of half-identical regions.
Three-generation studies
When the autosomal DNA of a grandchild is compared to that of a
grandparent, the shared cM with the other grandparent on the same
side is easily inferred. The grandchild gets all 3400cM or so
of, say, his paternal autosomes from his father. If it is seen
that 1600cM of this came from the paternal grandfather, then the
other 1800cM must have come from the paternal grandmother. The
initial estimate of 1700cM shared by grandchild and paternal
grandmother can thus be updated to 1800cM when it has been
ascertained that grandchild and paternal grandfather share only a
below average 1600cM.
If the shared cM figures for the two grandparents add up to more
than the figure for the relevant parent, the implication is either
(a) that there is some measurement error or (b) that the
grandparents are related to each other or (c) that one grandparent
is related to a son-in-law or daughter-in-law.
As an example, I looked at A350254 and her daughter and her parents
on GEDmatch. The "Are your parents related?" tool reports "No
indication that your parents are related." A one-to-one
comparison with threshold 500 SNPs between the grandparents A099459
and A911236 finds "Largest segment = 4.9 cM". The one-to-many
results for grandchild A606590 show shared cM of 3585.0 with the
mother, 2066.6 with the maternal grandfather and 1535.9 with the
maternal grandmother. The discrepancy of
2066.6+1535.9-3585.0=17.5cM must comprise regions where the
grandchild is half-identical purely by chance with both
grandparents.
See facebook discussion and another facebook discussion.
Example III - Paddy and Terry
Terry and I got to know each other through the County Clare
Ireland Genealogy group and the Kilrush
Local
History Group page on facebook.com. We discovered that we
both have ancestors named McNamara who lived in the adjoining
townlands of Breaghva and Moveen West in the civil parish of
Moyarta on the Loop Head peninsula in the west of County Clare.
Terry's cousin Michael McNamara still lives in Breaghva and my
cousin Michael McNamara still lives in Moveen West. When
necessary, they are distinguished by the age-old Irish tradition
of using patronymics rather than surnames: Michael "Anthony" and
Michael "Pádraig" respectively. In any case, the surname is
invariably shortened to "Mack" in that part of County Clare, where
"Mack" is almost always short for McNamara (although I did know a
Tommy Mack, whose full name was Tommy McInerney).
Terry and I became facebook friends in January 2013 and met when
she returned to her mother's native Kilrush for the National
Famine Commemoration in May 2013. We have a lot in common besides
our McNamara roots. She is an excellent genealogist. When she
couldn't find Breaghva in the Tithe Applotment Book of 1827 for
Moyarta parish, she converted the acreages of all the townlands
from Irish acres to statute acres, compared them with the
corresponding acreages from the Ordnance
Survey, and discovered that Breaghva was originally
considered as part of the adjoining townland of Moyarta West,
where she found what is surely her McNamara ancestor living as
early as 1827. My McNamara relatives, on the other hand, are mere
blow-ins, and didn't come to Moveen West until my greatgrandfather
Old Johnnie McNamara arrived from a townland about 26km away on
his marriage in 1876. The two families have known each other since
then, but I have heard it explained many times that they are not
closely related.
Terry is also a technical expert in many areas. Her TNG site was among
those that inspired me to switch in August
2013 from tribalpages.com to TNG for my (password-protected)
online family tree. The fact that she had sent DNA samples for
herself to all three companies (FTDNA, 23andMe and ancestry.com)
and for both of her parents to both FTDNA and 23andMe was among
the triggers that finally persuaded me to send mine to FTDNA.
The Loop Head peninsula, where our ancestors lived, is bounded on
the south by the Shannon Estuary and on the north by the Atlantic
Ocean. A peninsular popluation by definition is not quite an
island population, but it is still a population group with a
limited number of founders and a certain lack of mobility when it
comes to finding marriage partners. So I was not too surprised to
find Terry's mother among my initial FTDNA-overall-matches. Sadly
she was gravely ill at the time and died a few weeks later (RIP).
Terry's first thought was that we are probably related on the
McNamara side after all, and that we should probably get our
respective cousins, the two Michael Macks, to submit DNA samples,
for both Y-DNA and autosomal DNA comparisons. But as Terry's
mother and my paternal grandmother come from the Loop Head
peninsula and all of their known ancestors lived there, the common
ancestor from whom the shared segments (or some of them) derive
might not be a McNamara at all.
[Example details moved here.]
Here I should probably give a counter-example. Joseph and Paul
(father and son) caught my attention among my
FTDNA-overall-matches because their ancestral names and places
include surnames and townlands in County Mayo which also appear in
my mother's family tree. My longest block with each of them is the
same 8.07cM block on chromosome 19. In this case, there is no
doubt that this block was inherited by the son in its entirety
from the father. I would not be in the least surprised to find
that both of them and myself all inherited it from a common
ancestor. The first surprise in this case was to find that Terry's
mother (from County Clare) also FTDNA-overall-matched Paul (with
roots in County Mayo), but not his father. This is another
spurious match. The second surprise was to find that my total
Shared cM with the son (33.64cM) was greater than my total Shared
cM with the father (26.53cM), even though the mother is of German
ancestry.
The many anomalies already noted in the relative lengths of
half-identical regions make it clear that short half-identical
regions are often merely half-identical by chance and are not
indicative of a close genealogical relationship. This gives rise
to the related questions of "how long is 'long'?" and "how close
is 'close'?
Peter Ralph and Graham Coop, who have a far better grasp of the
relevant mathematics and statistics than most of those writing
about genetic genealogy, have written about the identification
of
genomic regions shared between distant relatives and
conclude that "sharing a single long block doesn’t imply a
particularly close genealogical relationship". While the words
"long" and "close" are left open to different interpretations,
this is a good principle to bear in mind.
The ultimate answers to these questions depend on what
supplementary evidence is available:
- Are the people being compared known relatives?
- How strong is the traditional genealogical evidence linking
them?
- Equivalently, how good is the paper trail linking them?
- Is there evidence that one person may have inherited the
relevant (paternal or maternal) segment in the shared
half-identical region from an ancestral couple not shared with
the other person?
- Could there be a closer but undocumented relationship between
the two people?
- Is there a tradition of a relationship, but no matching paper
trail?
- How many known relatives of one person share the same
half-identical region with how many known relatives of the
second person?
- How many known relatives of one person share any
half-identical region with how many known relatives of the
second person?
- Is there a common ancestral surname?
- Is there a common ancestral place?
- Is the common ancestral place a townland, a parish, a county
or merely a country?
- Are regions being measured in cMs, in SNPs or in base pairs?
- How many other half-identical regions are there between the
people being compared?
- Is the objective to determine whether two people are related,
or whether a given half-identical region contains an identical
segment from a known common ancestral couple?
- How much of his or her genome has each person already mapped
to specific ancestral couples?
- How much time is available to correspond with potential
relatives and to research the potential relationships?
- How many people share longer half-identical regions with each
person?
- Is one of the people being compared an adoptee?
- Are the people being compared complete strangers?
No matter what the answers to the above supplementary questions,
the answers to the initial questions remain subjective.
I started out innocently assuming that I could prove my
relationship to all my FTDNA-overall-matches. Then I found the
spurious 9.1cM half-identical region in the previous example, and
began to dismiss anything below that. Finbar O'Mahony then advised
me that he does not normally contact anyone (presumably apart from
a known relative) whose longest half-identical region is less than
15 cMs, and I began to think about increasing my threshold
further. In other words, in the case of complete strangers,
the guidance is that anything under 15cM is short.
As the threshold for FTDNA-overall-matches is 20cM, one is left
wondering in the case of half-identical regions under 20cM whether
those who are not FTDNA-overall-matches are not half-identical on
the relevant region, or are half-identical on the relevant region
but lack enough small additional half-identical regions to make up
the 20cM threshold. This soon convinced me that it's probably not
worth the effort of investigating possible relationships with
those sharing longest half-identical regions under 20cM.
It was stated above that autosomal DNA contains a few hundred
segments of genealogical value per individual; this estimate is
based on dividing the total length of autosomal DNA (3587.1cM) by
a reasonable cut-off value for the length of a half-identical
region of genealogical interest, say 20cM.
As time has gone on, I have wondered whether the threshold should
be even higher than 20cM.
In other words, I still don't know where it is sensible to draw the
line, but I would certainly accept weaker DNA evidence if there is
corroborating genealogical evidence than if there is no genealogical
evidence at all. The argument is purely academic while I concentrate
on half-identical regions of 30cM and more for which I have still
not found a common ancestor.
As of 17 March 2015:
- I have 18 individuals at FamilyTreeDNA.com with whom I share
half-identical regions of 20cM or longer. Of these:
- three are known relatives for whose kits I have paid
(first cousins at 89.47cM and 70.44cM and a first cousin
once removed at 85.14cM);
- one is a relative who submitted her DNA sample
independently; there was some doubt as to our relationship,
which the matching DNA has now eliminated (fourth cousin
twice removed at 24.77cM);
- one is an adoptee (30.45cM);
- my relationships to the other fifteen (including a family
of five, comprising a mother, her daughter and three of her
sons) have still to be determined.
- I have 22 kits at GEDmatch.com with whom I share
half-identical regions of 20cM or longer. Of these:
- two are the known first cousins from FamilyTreeDNA.com;
- one is the known fourth cousin twice removed from
FamilyTreeDNA.com;
- one is the adoptee from FamilyTreeDNA.com;
- four are accounted for by the mother (3 kits) and daughter
(1 kit) in the extended family at FamilyTreeDNA.com, but the
three sons come in just below the 20cM threshold at
GEDmatch.com;
- conversely, two are accounted for by an individual (2
23andMe kits) who comes in just below the 20cM threshold at
FamilyTreeDNA.com;
- two are among the other ten FTDNA-overall-matches to whom
my relationship has still to be determined;
- five are accounted for by kits from 23andMe (4 individuals
plus 1 duplicate) to whom my relationship has still to be
determined; and
- five are accounted for by kits from Ancestry.com (4
individuals plus 1 duplicate) to whom my relationship has
still to be determined.
So, if anything, my own guidance is that it is unlikely that anyone
with Irish ancestry will be able to determine his or her
relationship to any individual sharing a longest half-identical
region below 20cM.
In the case of known relatives, guidance as to the length of
half-identical regions certain to come from the common ancestor is
in short (no pun intended) supply, but 20cM is clearly quite long
in this case. Indeed, this question did not arise in my own mind
until I found that I shared half-identical regions with a ninth
cousin twice removed. A half-identical region of 8.8cM/918SNPs
with that ninth cousin twice removed seemed very long. With a
known fifth cousin, my longest shared half-identical regions are
4.6cM/875SNPs and 3.8cM/1177SNPs, which seemed quite short in this
context.
With both of these known relatives, there is a suspicion of a
second relationship. My ninth cousin twice removed has Waldron
cousins, who could be my ancestors. My fifth cousin and I both
have O'Halloran ancestors as well as our known shared Keas
ancestors. What is the likelihood that our shared half-identical
regions contain shared segments from our known common ancestors
(as opposed to shared segments from these other possible common
ancestors)?
For now, I will have to leave these questions unanswered, but for
known relatives I will certainly look at all half-identical
regions greater than 1cM and greater than 500SNPs.
Among my 354 initial FTDNA-overall-matches, I had:
- 30 with Autosomal largest cM greater than or equal to Finbar's
threshold of 15; and
- 182 with Autosomal largest cM greater than or equal to my own
initial threshold of 9.1.
At GEDmatch.com as of 23 Dec 2013, I had:
- 19 matches with Autosomal largest cM greater than or equal to
Finbar's threshold of 15 (5 from FTDNA, 10 from 23andMe and 4
from ancestry.com; only 11 different e-mail addresses, due
either to multiple family members sharing an e-mail address or
individuals testing with multiple companies);
- 188 matches with Autosomal largest cM greater than or equal to
my own threshold of 9.1; and
- 1,311 matches with Autosomal largest cM greater than or equal
to the default value of 7.
It can be seen from these figures that probably only around one
in six FTDNA customers have copied their raw data to GEDmatch.com.
It can also be seen that GEDmatch.com's definition of a match
(apparently based solely on largest cM) includes far more
so-called matches than FTDNA's definition (apparently based on
additional criteria such as number of shared segments and total
shared cM).
I certainly suspect that the vast majority of the 1,311 matches
for the default GEDmatch.com parameters are false positives.
Besides, 11 e-mail addresses are much more manageable than 1,311!
For someone like me with a large database of confirmed blood
relatives (9,531 people on my father's side, but only 813 people
on my mother's side at Christmas 2013), 19 interested and
interesting matches is a poor return.
For a foundling or any adoptee with no confirmed blood relatives,
on the other hand, 19 interested and interesting matches would be
a fantastic return.
Now back to myself and Terry and her mother: In the segments
where my DNA is half-identical with Terry's mother, it could be
the case that either:
- Terry has inherited from her maternal grandfather, but I am
related to her maternal grandmother; or
- Terry has inherited from her maternal grandmother, but I am
related to her maternal grandfather; or
- something else is going on.
Until Terry and I can compare ourselves directly in the
chromosome browser, we cannot rule out possibility 3. If we could
compare ourselves directly, then we might find that we have
smaller half-identical regions within the half-identical regions
that I share with her mother.
While I had no known relative who had tested before me, perhaps
Terry has others besides her parents and we can do some sort of
further analysis to distinguish between possibilities 1 and 2 and
thus see on which side I match her mother.
Example IV - Paddy and Anthea
After a wait of almost three days, I heard back from Anthea, the
first FTDNA-overall-match that I attempted to contact when my
initial results arrived. She has already featured in passing in
some of my examples above.
Anthea told me a very interesting and totally unexpected story.
She has given me permission completely to publish any details of
her story, which in any case has been in the public domain for a
very long time, wherever I want. However, the details of how
she came to be adopted in Worthing in England in 1938 are of no
relevance here.
In short, Anthea's only evidence in the search for her biological
parents comes from DNA. She received her first autosomal results
from FamilyTreeDNA.com on 10 February 2012. She was my closest
initial FTDNA-overall-match by Shared centiMorgans (119.09108) and
my second closest by Longest Block (30.45). We have 16 Shared DNA
Segments. A year later, she was still my closest match by Shared cM
and by Longest Block (ignoring my two known first cousins), and I
was her closest match by Shared cM, but had dropped from 5th to 7th
among her matches by Longest Block. Anthea soon admitted that she
and her husband "do not understand chromozones [sic] or
triangulating!" That was further motivation for me to try to explain
these topics more clearly here.
By looking at my FTDNA-overall-matches in common with Anthea, it
soon became apparent that we must be connected through my mother,
as many of the ICW matches, like my mother, had roots in the
triangle between Swinford, Charlestown and Kilkelly in County
Mayo. When the Family Finder results for my paternal and maternal
first cousins arrived, they confirmed that my relationship to
Anthea is on my maternal side. However, the connection to the
first of my maternal first cousins to submit a DNA sample
(estimated by FTDNA as 4th
Cousin - Remote Cousin) is not as strong as the
connection to me (estimated by FTDNA as 2nd
Cousin - 4th Cousin), implying that the relationship must
be less close than was suggested by my own results alone. When
another of my maternal first cousins later submitted a DNA sample,
the estimated relationship had to be revised again, and it now
appears to be closer to the initial estimate.
As of 29 July 2016, Anthea's closest match is an estimated second
cousin at AncestryDNA. Initial analysis points very strongly at
one pair of his greatgrandparents as direct ancestors of Anthea,
so the puzzle may be 25% solved.
A lady whom I will call Anne is
Anthea's top FTDNA-overall-match by the old default sort order
(i.e. by longest block). It is surprising that Anne and I had not
met before we discovered this DNA connection, as we have
connections in the worlds of academia and local history and
numerous mutual friends, and as her maternal ancestors and my
paternal ancestors have roots in adjoining parishes in County
Clare. All this is pure coincidence, however.
Anne subsequently obtained DNA samples from her full-brothers
Garry and Terence and their first cousin Patricia (brothers'
children). Neither brother is deemed an FTDNA-overall-match to
Anthea at all, but Patricia is. This raises a number of questions.
First of all, it clearly implies on the one hand that FTDNA's
estimated relationships between Anne and Anthea and between Anne
and Patricia (2nd Cousin - 4th Cousin in both cases) must also be
revised outwards but on the other hand that FTDNA's estimated
relationship between Anne's brothers and Anthea (none at all) must
be revised inwards. (Recall that FTDNA's estimated relationships
consider solely the DNA of the two people being compared, and
completely ignore the DNA of known relatives of either party.)
At the next level, the fact that one sibling can top someone
else's match list and the other not appear on it at all suggests
investigating the Shared Segments between the matches, in this
case between Anne and Anthea and between Patricia and Anthea.
Between Anne and Anthea, there is one Shared Segment of 43.53cM
but there is no other longer than 4.14cM. Between Patricia and
Anthea, there is one Shared Segment of 23.52cM but there is
no other longer than 4.21cM.
In fact, on Chromosome 10, based on GEDmatch comparisons:
- Anthea and Anne are half-identical to each other but not to
Patricia between 91,271,061 and 95,358,506;
- Anthea and Anne and Patricia are all half-identical to the
other two between 95,358,506 and 97,190,034 (1.5cM, 580 SNPs),
which may just be by chance;
- Anthea and Anne are half-identical to each other but not to
Patricia between 97,190,034 and 114,482,888;
- Anthea and Anne and Patricia are all half-identical to the
other two between 114,482,888 and 126,723,633; and
- Anthea and Patricia are half-identical to each other but not
to Anthea between 126,723,633 and 135,297,961.
Given that Anne inherited this long 43.53cM segment from one of
her parents, what is the probability that her full-sibling did not
inherit it, or did not inherit enough of it to register as an
FTDNA-overall-match with Anthea? Suppose this segment came from
the, say, paternal chromosome of one of Anne's parents. There is a
50% probability that her brother inherited from the corresponding
maternal chromosome at the relevant start location (91,205,789 on
Chromosome 10), and a Poisson probability of 64.71% of no
crossover throughout the relevant segment. Thus there is a
probability of over 32% that the brother does not match Anthea
anywhere in this region. If one allows for possible crossovers
near the ends of the region, or multiple crossovers, so that
Anne's brother and Anthea share small segments of DNA, but not
enough to meet the FTDNA thresholds, the ex ante
probability that Anthea and Anne's brother are not
FTDNA-overall-matches is clearly somewhat more than 32%. With two
brothers, since the events are independent, the probability can
just be squared, but there is still an ex ante probability
of over 10% that neither brother FTDNA-overall-matches Anthea.
Now suppose that Anne and Anthea were half-identical on two
separate regions, on two different chromosomes, each half as long
as the actual 43.53cM match, i.e. each 21.765cM long. The
probability that Anne's brother and Anthea don't match in one of
these regions is again the 50% probability that the brother
inherited the opposite chromosome at the start of the region,
multiplied by the relevant Poisson probability of no crossover in
the shorter region, which is clearly much larger, in fact 80.44%,
giving a result of 40.22%. However, inheritance on two differenct
chromosomes is independent, so the probability that the brother
and Anthea don't match on either of the two regions is 40.22% x
40.22% or just 16.18%.
This gives the slightly counter-intuitive result that if you have
two FTDNA-overall-matches with the same Shared cM but different
Longest Block, you are more likely to match a sibling (or any
known relative) of the FTDNA-overall-match with the shorter
Longest Block.
Like the diversification principle in investment (which
essentially says "don't put all your eggs in one basket"), this is
essentially just another application of the Law of Large Numbers.
With DNA samples from three siblings and a first cousin, we can
try to divide their FTDNA-overall-matches into four subsets, one
subset for each grandparent of the sibling group. I will consider
the subset of FTDNA-overall-matches who are half-identical to
Anthea or to one of the sibling group on the region where Anne and
Anthea are half-identical to each other (Chromosome 10 between
locations 91,205,789 and 126,559,193).
The easiest way to do this is using the ADSA
for each of the four people, with "Chromosome to graph" set to 10,
"Base Pairs" set from 91205789 "to" 126559193 and "Minimum Segment
Length in cM" set to 8. I ignored some half-identical regions
which had only a tiny overlap with the start or end of the region
where Anne and Anthea are half-identical.
Let us label the grandparents as follows:
- 1A
- The paternal grandparent through whom Anthea is related to the
sibling group.
- 1B
- The other paternal grandparent (spouse of 1A).
- 2A
- The maternal grandparent from whom Anne inherited on this
region.
- 2B
- The other maternal grandparent (spouse of 2A).
The autosomal DNA of the three siblings alone could not tell us
whether 1A and 1B were the paternal grandparents and 2A and 2B the
maternal grandparents or vice
versa. However, the fact that a paternal cousin is
half-identical to Anthea on the same region confirms that the
relationship is through one of the paternal grandparents.
Likewise, autosomal DNA alone still cannot tell us whether A is
the grandfather and B the grandmother or vice versa on either side.
On side 1, Anne has inherited from grandparent 1A and, as Garry
and Terence do not match Anthea, they must both have inherited
from grandparent 1B.
Garry is half-identical to both of his siblings on this region,
so he must have inherited from the same grandparent as Anne on the
other side, i.e. from 2A.
Anne and Terence are not half-identical on this region, so they
must have inherited from opposite grandparents on both sides; in
other words, Terence inherited from 1B and 2B.
So we have the following pattern:
- 1A
- Anne and Anthea and Patricia
- 1B
- Garry and Terence
- 2A
- Anne and Garry
- 2B
- Terence
It follows that anyone who is half-identical to Anne and Anthea on
this region is related through grandparent 1A; anyone who is
half-identical to Garry and Terence is related through grandparent
1B; anyone who is half-identical to Anne and Garry is related
through grandparent 2A; and anyone who is half-identical to Terence
only is related through grandparent 2B. Finally, anyone who is
half-identical to Anthea on this region but not to any of the three
siblings is related through Anthea's other parent, whom I will label
3. There are 10 other possible subsets of Anthea, Anne, Terence and
Garry. If anyone matches one of these other subsets, it could be for
one of two reasons:
- (s)he is half-identical by chance to one of the group; or
- (s)he is half-identical to another member of the group in this
region, but is not an FTDNA-overall-match to that member because
their total Shared cM is less than the FTDNA threshold value of
20.
There is also an outside chance that either of these reasons
could also result in a person being assigned to the wrong group,
unless the lengths of the relevant half-identical regions are 20cM
or greater.
The following table shows the matches and categories:
|
cM length of
half-identical region with |
|
| Match surname |
Anthea |
Anne |
Garry |
Terence |
Grandparent group |
| Lewis |
8.20 |
9.19 |
|
|
1A |
| Likens |
20.91 |
34.81 |
|
|
1A |
| James |
|
|
9.90 |
9.90 |
1B |
| Bean |
|
17.59 |
18.01 |
|
2A |
| Fetherston |
|
13.60 |
14.29 |
|
2A |
| Johnson |
|
9.70 |
9.89 |
|
2A |
| Murphy |
|
11.15 |
11.27 |
|
2A |
| Smoyer |
|
10.00 |
9.34 |
|
2A |
| Swanson, A |
|
13.79 |
13.79 |
|
2A |
| Swanson, M |
|
13.38 |
13.38 |
|
2A |
| Wellar |
|
9.81 |
8.99 |
|
2A |
| Blake |
9.53 |
|
|
|
3 |
| Clifford |
12.16 |
|
|
|
3 |
| Laffey |
16.63 |
|
|
|
3 |
| Peneycad |
8.46 |
|
|
|
3 |
| Doble |
|
8.00 |
|
|
ambiguous |
| McDade |
|
8.29 |
|
|
ambiguous |
| Mellick |
|
8.22 |
|
|
ambiguous |
| Ottum |
|
|
9.25 |
|
ambiguous |
| Scott |
|
|
8.25 |
|
ambiguous |
| Svircev |
|
|
8.25 |
|
ambiguous |
It is reassuring that the two people in grandparent group 1A,
matching Anne and Anthea, namely Lewis and Likens,
FTDNA-overall-match each other.
Of the eight people in group 2A, matching Anne and Garry, Smoyer
and Johnson FTDNA-overall-match each other; Johnson, Murphy, the
two Swansons and Bean FTDNA-overall-match each other; the
Swansons, Bean and Fetherston FTDNA-overall-match each other; and
Bean, Fetherson and Wellar FTDNA-overall-match each other. These
subgroups arise from different subregions of the long region where
Anne and Anthea are half-identical.
Of the four people in grandparent group 3, matching Anthea only,
only Blake and Peneycad FTDNA-overall-match each other, leaving
the possibility that the other two may be half-identical by chance
to Anthea.
The next stop is to look for common ancestors of the three
siblings and each of the four grandparent groups in the above
table. If the common ancestor with group 2A can be identified,
then we will know that Anthea is related through the other parent.
If the common ancestor with group 1A or group 1B can be
identified, then we will know which grandparent Anthea is related
to.
There is a lot more work still to be done!
Update: Since I compiled the above table, two Kane samples have
been submitted to FTDNA. In the region of interest, they are
half-identical to Anne and Garry (12.94cM and 12.69cM for both
siblings) but not to Anthea or Terence, so they must be related to
grandparent 2A.
For another interesting example concerning my Kett
GGGgrandfather, see facebook discussion.
Interpreting Y-DNA results
Y-DNA comparison is the best way to rule in or rule out distant
relationships between men with the same or similar surnames. For
closer relationships, autosomal DNA comparison gives more precise
answers.
Only men have a Y chromosome for comparison.
A woman does not have a Y chromosome, so should find a male
relative with the relevant surname to swab:
- a father, brother, nephew, cousin, etc., if her interest is in
her maiden surname; or
- a husband, son, brother-in-law, father-in-law, etc., if her
interest is in her married
surname.
By far the most comprehensive Y-DNA service is provided by FamilyTreeDNA.com, but there are competitors
like YFull.com
and YSEQ.
If you have already sent cheek swabs to FamilyTreeDNA for Family
Finder or mitochondrial analysis, then they are held in storage
and will be re-used for Y-DNA analysis.
SNPs and STRs
Y-DNA analysis began many years ago by looking at patterns of STR
values from the Y chromosome. These values mutate relatively
frequently in both directions.
One could purchase Y-DNA12, Y-DNA37, Y-DNA67, Y-DNA111, etc., which
compare the number of repeats in 12, 37, 67 or 111 STRs
respectively. As of 2024, only Y-DNA-37 and Y-DNA111 were still
being sold. These numbers can be viewed in the Y-DNA results pages
for various projects, such as the Clare Roots project.
More recently, once-in-the-history-of-mankind SNPs began to be
identified. These mutations have occurred exactly once. Every man
descended from the man in whom the mutation originally occurred
inherits the mutation. No other man has the mutation. Men with the
same SNP mutation tend to also have similar patterns of STR
mutations, so STR mutations can be used to predict SNP mutations.
It was eventually realised that these SNPs are a much better way of
categorising men than the patterns of reversible STR mutations which
were originally used on their own.
STR analysis remains cheaper than SNP analysis, so it is still the
cheapest starting point for Y-DNA analysis.
A man's most recent SNP mutation will generally be a few hundred
years old, but many men will have a number of more recent STR
mutations.
Hence, STR analysis remains the best way of estimating close
relationships between men of the same surname, particularly a
surname with a single genetic origin, while SNP analysis is more
suitable for large scale surname studies investigating genetic
relationships between men who have different surnames or whose
surname has multiple genetic origins.
Originally, whether one went further down the STR or SNP route was a
matter of taste and a matter of debate, but now it is purely a
matter of budget, and cost is now the only reason not to start with
Big Y-700.
Objectives
Y-DNA analysis can have various objectives, but the principal ones
include:
- to identify the original surname which was subject to a surname/DNA switch (SDS),
whether known of from other sources (e.g. adoption) or first
discovered through DNA comparisons;
- to identify the most recent SNP mutation in a man's lineage;
- to determine whether that most recent SNP is specific to the
man's surname or occurred before the surname was adopted by his
male line ancestors;
- to identify any STR mutations that have taken place in the
man's lineage since the most recent SNP mutation and/or since
the most distant known patrilineal ancestor;
- to estimate, using STR mutations, how close the relationship
is between two men with the same surname and same most recent
confirmed SNP but without a known common ancestor;
- to verify traditions relating to common origins of different
modern surnames (see here);
- etc.
The optimal order in which to purchase DNA products may depend on
which of the above objectives are of most importance, on the results
of previous purchases, on whether close relatives are already in the
Y-DNA system, and on the budget available.
The prices were formerly less for men who had joined a surname or
geographical project before or at the time of ordering. You may be
able to find an appropriate project here.
Alternatively, you can just do a Google search for
[surname] FTDNA project
If there is no surname project for your surname, then you can apply
to set up your own project by following a simple five-step application process (which actually consists
of only four steps!).
Once you have your initial Y-DNA results, you can also join
appropriate haplogroup projects.
For numerous reasons, we need more men to order Big Y-700 and to
join the relevant surname, geographic and DNA-based projects at
FamilyTreeDNA.com. For example:
- this modern SNP-based analysis provides far more accurate
matching than the now outdated STR-based analysis provided by
Y-37 etc.;
- it overlays SNP mutations and surnames on the Tree of Mankind;
- surname-specific SNP mutations are being discovered all the
time, many of them not just surname-specific but even
parish-specific;
- SNP mutations can not be formally recognised until they have
been found in two different men;
- many project members still find themselves alone in a group on
the Y-DNA Colorized Chart, and will remain alone there until
another closely or distantly related man signs up for Big Y-700;
- SNP analysis can provide clearer evidence as to whether there
have been surname/DNA switches within the surname era, or two
unrelated founders adopting the same surname at the start of the
surname era;
- etc.
The first step is to order a
Y-DNA product. There are a number of possible routes:
- If your budget is limited, then the entry-level purchase is
Y-DNA37, which examines 37 STR locations on the Y-chromosome.
The Y-DNA37 results can still be used as a guide to the best
subsequent purchases.
- The recommended top-of-the-range purchase is Big Y-700, which
replaced Big Y-500 on 30 January 2019; Big Y-500 had replaced
Big Y only in April 2018.
- If you just want to confirm that you have the same confirmed
SNP mutation as a suspected relative with your surname, then you
can start with Y-DNA 37 and order a single SNP test from YSEQ
when the Y-DNA37 results are available (and have confirmed that
your first 37 STRs match your suspected relative).
Big Y-700 will give you a confirmed recent SNP. Y-DNA37 or even
Family Finder will give you a predicted ancient SNP.
Y-DNA37 will also give you a list of matches, i.e. men with similar
patterns of STR values.
In principle, your match list should contain dozens of men with your
exact surname.
In practice, there are many reasons why this may not be the case:
- your surname (or your male line beyond the adoption of your
surname) may not be one of those which have proliferated due to
many men of the surname (or male line) each having several sons;
- your surname (or male line) may be in danger of being
"daughtered out", due to many men of the surname (or male line)
not marrying or fathering only daughters;
- there may be no other man of your surname in the FTDNA
database (e.g. no Geheran in February 2018);
- there may be only a few people of your surname in the FTDNA
database (e.g. there were only 11
Dungans of either gender in February 2018);
- there may have been no concerted effort to recruit men of your
surname to the FTDNA database;
- there may have been a concerted effort to recruit men of some
genetically related surname to the FTDNA database;
- the men of your surname in the FTDNA database may not yet have
ordered any Y-STR product;
- there may have been an above average number of STR mutations
in your male line in recent generations, resulting in few
matches of any surname;
- there may have been a below average number of STR mutations in
your male line since the adoption of surnames, resulting in many
matches with men whose common ancestry predates the use of
surnames;
- there may have been an overt or covert surname/DNA switch in your
male line since the adoption of surnames;
- your surname may have multiple independent genetic origins;
- etc., etc.
The remainder of this chapter will show how to use your initial
Y-DNA37 results to predict more recent SNPs for which you may
be positive, and hence to determine which further purchases you
should make in order to confirm your most recent SNP.
Preliminaries
A list of potential Y-DNA matches without surnames and further
details of the most distant known male-line ancestor is next to
useless.
New FamilyTreeDNA.com customers need to fill in the names of both
their Direct Maternal (i.e. matrilineal) and Direct Paternal (i.e.
patrilineal) Most Distant (i.e. most distant known) Ancestors here in
order to help those looking for mitochondrial DNA matches and
Y-DNA matches respectively. An extraordinarily high proportion of
customers have failed to attempt this, or have attempted it but
have filled in details of the wrong ancestors, often filling in
details of ancestors of the wrong gender. It is
particularly important for anyone who has ordered mtDNA
analysis and for men who have ordered Y-DNA analysis to fill
in details of these ancestors which then appear in the
relevant project reports, but it's a good idea for all FTDNA
customers to fill in the details, which then show on the basic
customer profile shown to those who match any part of their
DNA.
Most people squeeze in names, places and dates to the limited
string length of 50 characters available for the names of the most
distant ancestors, but FamilyTreeDNA really should provide
separate fields and columns for name, birth date, death date,
country, county, etc., to help those scanning this information in
the tables in surname projects and mitochondrial projects.
As I have already noted, some people are actually confused by the
simple concept that Y-DNA follows the male line, and even by the
simpler concept that in most cultures the surname generally, but
not always, follows the same male line. Even more people are
confused by the related concept that in many cultures grants of
arms generally, but not always, follow the male line and the
surname. Y-DNA will identify relationships that go back much
further than the adoption of surnames, which in most cultures was
around or after the year 1000 AD. Other cultures, for example
European royalty, still do not use surnames in the 21st century.
Surname/DNA switches
In practice, there are many exceptions to the foregoing cultural
principles, which result in sons inheriting DNA from their genetic
father, but not inheriting the exact surname used by their genetic
father.
The spelling of surnames mutates over the generations in much the
same way as DNA mutates. After many generations, the surnames used
by two men from the same genetic male line may end up being
unrecognisably different.
A surname/DNA switch is
defined as the use of a surname different from that used by the
genetic father, which may be:
- a surname inherited from someone else; or
- a surname translated in some way from the genetic father's
surname.
Surname/DNA switches are just one cause of surnames having multiple
DNA signatures. Many surnames, particularly occupational surnames
and surnames in countries which have had many immigrants speaking
one or more foreign languages, have multiple independent genetic
origins for more mundane reasons.
When the surname does not follow the male line, some genetic
genealogists once used the term non-paternity event (NPE),
but
most now prefer to refer to these occurences more precisely as
surname/DNA switches. After all, every birth involves paternity,
so NPE is now more usually expanded as "Not the Parent Expected"
and used when the DNA results do not match the oral family
tradition.
Among the myriad of, possibly one-off, circumstances causing
surname/DNA switches (and other forms of NPE) are:
- adoption (including of foundlings), with the suname inherited
from the adoptive father;
- foundlings given a surname based on where or by whom they were
found;
- infidelity, with the surname inherited from the mother's
husband;
- use of sperm donors, with the surname inherited
from the man who raised the child;
- parents giving every second child the father's surname and the
mother's surname, with some inheriting the surname from the
mother;
- men using their mother's surname for other reasons;
- men using their stepfather's surname;
- a change of surname associated with inheritance of a family
estate, with the surname inherited from the benefactor;
- men (possibly include this writer's own brother) going on the
run for all sorts of reasons and changing their surname to avoid
being traced, whether running away from the law, from political
opponents, or from their families, perhaps even wishing to
commit
bigamy;
- men using their maternal grandmother's maiden surname (see example below);
- translation of a surname back and forth between languages in
different ways (see Sir Robert Edwin Matheson's Varieties and synonymes of surnames and
Christian names in Ireland: for the guidance of registration
officers and the public in searching the indexes of births,
deaths, and marriages);
- inconsistent standardisation of the spelling of a surname once
the computer age put an end to spelling diversity;
- reverting to an ancient spelling of a surname discovered in
the course of research;
- etc.
There are many examples of surname/DNA switches in the pedigrees
of recent world leaders, including the following:
- The president of the United States of America from 1993 to
2001 had Blythe Y-DNA but was known as Bill Clinton. His father was killed
in a car accident more than three months before he was born and
he later took the surname of the first of his three stepfathers.
- The prime minister of the United Kingdom of Great Britain and
Northern Ireland from 1990 to 1997 had Ball Y-DNA but was known
as John Major. His
father Abraham Thomas Ball was a music hall performer, who
initially used Tom Major merely as a stage name.
- The prime minister of the United Kingdom of Great Britain and
Northern Ireland from 2019 to 2022 had Kemal Y-DNA but was known
as Boris Johnson.His
paternal grandfather Osman Wilfred Kemal's mother died in
childbirth in 1909 and the baby was brought up by his maternal
grandmother Margaret Hannah Brun née Johnson and became known as
Wilfred Johnson. While Prime Minister Johnson has Kemal Y-DNA,
he has a surname that was not used by any of his eight
greatgrandparents and that descended via a female GGgrandparent.
See here.
Grants of arms have historically been associated with specific
families and never with surnames; thus sharing a surname does not
automatically confer the right to bear the same arms. Similarly,
sharing a surname does not automatically mean that two men carry
the same Y-DNA.
Genetic Distance
Roughly speaking, two men are genetic
distance x/y
apart if they have both had y
STR markers examined and there are x differences between the two sequences of y numbers, e.g. genetic
distance 2/37 usually means 35 of the 37 numbers are the same.
I was initially under the misapprehension that genetic distance
was a simple count of the number of differences between the
sequence of integers reported for two individuals. For example,
two individuals who have purchased Y-DNA37 and are reported to
have a genetic distance of 2/37 might be expected to have the same
results in 35 positions in the sequence and different results in
the other 2 positions in the sequence. The actual situation turns
out to be much more complex than this. Some of the numbers
reported are related. For example, the 10th and 12th numbers in
the sequence both relate to DYS389. One mutation can cause both of
these numbers to change. Similarly, the 22nd, 23rd, 24th and 25th
numbers in the sequence are all related to DYS464. One mutation
can cause more than one of these four numbers to change. For some
men, Y-DNA37 results may contain more than 37 numbers. For
example, most men have four numbers for DYS464, but some O'Deas
have six numbers, as can be seen on the results page. For more details, see Deconstructing TMRCA & Genetic Distance
by John Barrett Robb.
Y-DNA genetic distance is no more closely correlated with
genealogical relationship than shared centiMorgans of autosomal
DNA. Note also that lower genetic distance indicates a closer
relationship, while higher shared centiMorgans indicates a closer
relationship.
Terry Barton of WorldFamilies.net gives a nice example in
his 2008 interview with Blaine Bettinger: "my
Dad and I each started a mutation (his is at DYS388, while mine is
at DYS452) So, I am 41/43 when compared to my Uncle. I use this
example to explain how you can’t count mutations to determine how
closely related you are to someone ... Dr. Richard Barton [and
myself] have no paper trail connection [but] Rich is a 43/43 match
to my Uncle."
Matching criteria
FamilyTreeDNA deems to men to be matches (see here) if they are within:
- a Genetic Distance (GD) of 0 at 12 markers;
- a GD of 2 at 25 markers;
- a GD of 4 at 37 markers;
- a GD of 7 at 67 markers; or
- a GD of 10 at 111 markers.
The exception (see here) is that for 12 markers the cut-off is 0
unless in a common project, then 1.
Two men who have bought x
and y markers respectively
should view themselves as matches only if they match at min(x,y). It is irrelevant whether
or not they would have been matches at z<min(x,y)
markers. However, the FTDNA interface and e-mail notifications still
show these "would-have-been-matches", although it is now irrelevant
information, and a non-match at a higher number of markers trumps a
"would-have-been-match" at lower number of markers. Given that both
men have paid for more markers, the fact that they are, say, 1/12
apart is totally irrelevant. There is nothing special about
the first 12 markers or the next 25 markers. Measures based on more
markers supercede all measures based on fewer markers.
FamilyTreeDNA will hopefully eventually realise this and fix its
matching interface and notification policy.
Project administrators can see comparisons (for non-matching project
members) out to 7/37, 25/67 and 40/111. If two men have good reason
to suspect a relationship to each other, but appear to be just
outside the matching threshold, then they should join the same
project and ask the administrators to check their genetic distance
from each other. Indeed, I have come across cases where two men are
just outside the project administrator threshold but are almost
certain to be related within the surname era. The triangular
inequality or simple counting of STR differences can be used in
these cases.
Finding actual and potential Y-DNA matches
Having made yourself findable by others who share your surname
and potentially share your Y-DNA, the next step is to look for
such men in the FamilyTreeDNA community.
On the Surname & Geographical Projects page,
FamilyTreeDNA has a "Project Search" box (the search box at the
top of the right-hand column). This actually functions as a
Surname Search box. Whether or not one is logged in, one can enter
a surname and see results like this:
The following names matched your search request:
The COUNT is apparently the number of FTDNA customers with the
surname. It is not clear whether it is the number of male
customers, the number of Y-DNA customers, the number of customers
whose results are fully processed, the total number of customers
who have ordered kits, or what. It can at least be used to give an
upper bound on the number of men with the same surname with whom
another male can potentially compare his Y-DNA.
FamilyTreeDNA provides the infrastructure for volunteer
administrators to run projects, including surname projects and
other types of Y-DNA projects.
Notifications
FamilyTreeDNA.com insists on sending e-mail notifications of what
it deems Y-DNA "Test Matches"; the customer has little control
over what is deemed worthy of generating an e-mail, so a "Test
Match" may be somebody with a different surname, no online family
tree, no Most Distant Ancestor recorded, and the sixth such match
at a genetic distance of two steps on a 37-marker scale. One
e-mail alerted me to an individual with a different surname for
whom the data could not reject the null hypothesis that we did not
share a common ancestor within the last 14 generations; he was
still my closest Y-DNA match at the time. These probability
calculations appear to be blind to the surnames of the men whose
Y-DNA is being compared.
FamilyTreeDNA's e-mail notification policies are very inflexible:
I don't want e-mails about distant Y-DNA matches with different
surnames with whom I have no hope of establishing a genealogical
relationship, but must receive them; I do want e-mails about
possible distant cousins who are deemed to be my Family Finder
matches, but the FAQs
state that FamilyTreeDNA.com does "not send notifications for
Family Finder matches that are more distant than 3rd cousins".
This should presumably be interpreted as indicating a high
likelihood of false positives amongst such matches.
Once you have received your Y-DNA37 (or higher) results, you will
probably want to control the flow of e-mail notifications of new
matches. On the Email Notifications page, as the entry-level
Y-DNA product is now Y-DNA37, you will probably want to untick
the Y-12 and Y-25 boxes (unless you have very few or no Y-DNA37
matches). If you leave these ticked, remember that when you get an
e-mail notification of a new Y-DNA12 or Y-DNA25 match, then:
- the new match has probably bought Y-DNA37 and been deemed to
be more than genetic distance 4/37 from you (i.e. not a match);
and
- on the Y-DNA - Matches page, you will need to
select 25 or 12 as appropriate from the Markers: dropdown menu
in order to see your new match.
An example: Waldron Y-DNA
In the case of Waldron, the COUNT of FTDNA customers with the
surname Waldron was 29 when I first learned of this search
facility on 26 October 2015; it had not increased as of 23
December 2015, but had grown to 60 by 23 Jul 2017.
Further down the search results, it was stated that there
were 33 members in the Waldron project on 26 October 2015;
this too had not increased as of 23 December 2015, but had
increased to 49 by 23 Jul 2017.
There are several places on the FamilyTreeDNA website where one
might find relatives using Y-DNA, including:
- Surname projects:
The Waldron project is an example of a surname project. There
are several pages of interest associated with each surname
project, including:
Some of these pages seem to exist only for projects
"participating in the myGroups Beta".
What you see on these pages depend on whether or not you are
logged in as a member of the project.
Of the first 33 Total Members in the Waldron project, three had
purchased Y-DNA12, another ten had purchased Y-DNA37, another
six had purchased Y-DNA67 and another two had purchased
Y-DNA111, so in theory 21 people should have appeared on
the Y-DNA Colorized Chart as of 19 February
2016; in practice only 20 did to those logged in as project
members, and only 17 appeared to those not logged in.
The obvious inference is that there were a further 12 Waldron
project members who either were female or were male and had not
purchased any Y-DNA product.
Of the first 20 on the Y-DNA Colorized Chart, 16 had surnames
beginning with Wald-.
I exactly match one of the three Y-DNA12 only project members:
N41617. As there is no way of getting directly from the Waldron
project page to his FTDNA profile, all that I could see for many
months is that his name is WALDRON and that he has left his
Paternal Ancestor Name blank.
- The Y-DNA
-
Matches page:
As of 7 Apr 2014, if I switch on e-mail notifications here,
I can see 3483 12-marker matches via this page; none of them has
"Last Name Starts With:" matching Waldron or WALDRON. I don't
understand why N41617 appears on the surname project page, but
not on the matches page. Perhaps he has turned off e-mail
notifications, thereby hiding from his 12-marker matches. To
avoid a flood of unwanted spam e-mails, I have turned off
everything below 37-marker comparisons.
On 7 Feb 2014, I was notified of my sixth Family Tree DNA
Y-DNA37 Test Match having a genetic distance of 2 or less
(roughly speaking, matching on 35 or more of 37 markers). I had
one "36-of-37" match and five "35-of-37" matches as of 30 Nov
2015, but I had no 37-marker match at any reported distance with
surname beginning with Wal-. I have two Walshes and two Walkers
who are "23-of-25" matches, but have further differences in the
next 12 markers.
I have two theories as to why I have no Y-DNA matches sharing my
surname:
- I may descend from the well-documented Waldron family who
came to Ireland with the Ulster Plantation of 1609; however,
the documented male line of this family appears to have died
out, and so cannot be represented in DNA databases; or
- My Waldron greatgrandfather or my Waldron
greatgreatgrandfather may not be genetically Waldrons; there
is plenty of autosomal DNA evidence that my paper-trail
Waldron greatgrandfather and his mother were my genetic
ancestors, but I need to recruit further DNA donors to
confirm my ancestry beyond this point.
Of the six men at a genetic distance of 2 or less from me on the
37-marker test, one was initially predicted to be from
haplogroup R-Z383, three from R-M269, one from R-U106, and one
from R-L148. Only four of the six are willing to be contacted by
e-mail by their Y-DNA37 matches and only two of the six give any
information about their ancestry. By 30 Nov 2015, only one of
the six was showing any ancestry information; one now had
confirmed haplogroup R-Z383, and the other five were now all
predicted R-M269.
- The Advanced Matching page:
Log in as a kit number, not as a project administrator, before
following this link. Click the Select All box at the top left;
select your surname project (or any other project that you have
joined) from the "Show Matches For:" dropdown menu and set
Results Per Page to whatever you prefer (I always set these to
the maximum available, 500 in this case, so that I can use
Ctrl-F to search as many of the results as allowed). Then
point-and-click the Run Report button towards the bottom right.
Over a year after I was matched with the mysterious N41617, I
found a link to his profile here and discovered that he is my
first cousin once removed, with whom I had discussed DNA testing
away back in 2007. I then persuaded him to also order the Family
Finder test.
My efforts, and those of the Waldron Clan Association in County
Mayo organising the 2013 Waldron Clan Gathering, to communicate
with the administrators of the Waldron project were slow to get
off the ground, but we eventually made contact in December 2015.
I am advised every time I get an e-mail about a very distant
Y-DNA match that "We recommend ordering the Y-DNA67 to narrow down
your matches with more precision & confidence." It is not
immediately obvious why this recommendation is of any relevance
until such time as I have at least two people matching me on all
of the 37 markers that I initially purchased. Apart from being a
good marketing ploy, the principle seems to be that "65-of-67" or
"64-of-67" matches are typically more closely related than
"35-of-37" matches. Furthermore, all expert advice now is that
identifying and ordering a relevant SNP pack is better value than
an STR upgrade.
Haplotrees, haplotypes, terminal SNPs, most recent confirmed
SNPs, predicted haplogroups and confirmed haplogroups
The science or art of placing men on the human family tree or Tree of Mankind, often called
the Y haplotree, has
evolved rapidly in recent years.
Men were originally divided into 18 categories identified by the
letters A-R, based mostly on patterns in their STR results. These
patterns are generally referred to as haplotypes.
The original 18 categories were repeatedly subdivided as more
patterns were recognised. For example, category R was divided into
R1 and R2, and R1 was then divided into R1a and R1b.
A man's place in the human family tree is now generally described by
his most recent confirmed SNP,
misleading described as his terminal
SNP. "Terminal" has an implication of finality and
permanence, but a man's most recent confirmed SNP can actually
change frequently for two reasons:
- he may purchase additional SNP
tests (single SNPs, SNP packs or Big Y-700) for
SNPs which are descendants of his current most recent confirmed
SNP; and
- additional once-in-the-history-of-mankind SNPs (for which he
is positive) may subsequently be identified.
One could debate whether "identified" or "confirmed" is the best
adjective to use in this definition; either is more appropriate than
"terminal".
The word haplogroup has
long been used to describe any group of men with similar Y-DNA. Its
meaning has evolved with the science of analysing the Y chromosome.
FTDNA now uses "haplogroup" (on the Y-DNA Colorized Chart) interchangeably
with "Terminal SNP" (on the Y-DNA - Matches page).
FamilyTreeDNA uses patterns in STR results to predict a SNP for
which a customer who has not purchased any SNP tests will almost
certainly test positive. This gives a predicted haplogroup such as R-M269, described by
the original top-level category (A-R), followed by a dash, followed
by the SNP identifier, which comprises one or more letters followed
by one or more numbers, occasionally also including an underscore
(_), e.g. R-M269 or R-ZZ12_1. This predicted haplogroup is often
displayed in red.
The various types of SNP tests sold by FamilyTreeDNA can confirm the
predicted haplogroup or confirm that the man belongs to a particular
subclade of that haplogroup,
so that a man originally predicted to be R-M269 may find himself in
the subclade R-L226, sometimes described as his confirmed haplogroup.
Ultimately, most men can find that they are positive for a sequence
of SNPs of decreasing antiquity. In my own case, these are
M269>L23>L51>L151>U106>Z381>Z301>L48>Z9>Z30>Z27>Z345>Z2>Z7>Z8>Z338>Z11>Z12>Z8175>FGC12057>Z383>FGC29367.
So
I belong to the haplogroups R-M269, R-L23, R-L51, etc., each of them
a subclade of the preceding ones. In the future, I may find that I
am positive for newly-discovered SNPs both upstream and downstream
from FGC29367.
If you have known male line relatives from whose results your own
place in the human family tree can be predicted, then you may be
better off starting with the very basic Y-DNA12 (which you can order
here) and moving straight on to relevant SNP
tests. If you want to know your place in the human family tree or
SNPs as precisely as is currently possible, there is no scientific
reason why you should squander extra money on STR products. However,
if two men have the same most recent confirmed SNP and are confirmed
to be negative for all known downstream SNPs and do not know their
common ancestors, then they will get a more precise estimate of
their relationship from STR comparisons.
The original Big Y test reported SNP results but no STR results, but
could only be ordered by those who had already ordered at least
Y-DNA12. The newer Big Y-700 test now includes not just Y-DNA111,
but a further 589 STR markers, which, however, are not used for
computing genetic distance or match lists.
Estimating the age of
SNPs
Two men who test positive for a particular SNP will naturally be
curious as to when the first ancestor with that mutation lived.
These instructions are taken from the FTDNA forums:
- Go to YFull's SNP search page
- Enter a SNP identifier (e.g. L226, without the top-level
haplogroup letter) and click the Search button
- A green hyperlink, labeled with a haplotree branch name
(e.g., R-L226, with the top-level haplogroup letter),
should be displayed. Click on it.
- You should now see a branch of the haplotree. Typically, this
branch will have two dates:
- The "formed" date is an estimate of when this branch began
to diverge from its surviving siblings. (Extinct siblings are
unknowable and therefore ignored.)
- The "TMRCA" date is an estimate of when this branch's
surviving children began to diverge from each other. (Again,
extinct lineages are ignored.)
If your SNP of interest has been discovered recently, of course, it
may not appear in YFull's haplotree yet.
Many experts assert, based partly on tests of ancient DNA, that
YFull's age estimates are 10-20% too low. On the other hand, many of
those same experts assert that a haplotree branch typically goes
through a gestation period before a major expansion. In other
words, there may be several generations between the man in whom the
mutation first occurred and the first generation of his descendants
including two brothers who both have descendants alive today, so
that the most recent common ancestor of those with the SNP is
several generations after the original mutation. This hypothesized
gestation interval may effectively cancel out the alleged 10-20%
error.
My own Y-DNA results
FamilyTreeDNA initially predicted from my own Y-DNA37 results and
from my known first cousin once removed's Y-DNA12 results that we
are both from haplogroup R-M269.
However, my known first cousin once removed has also done the Genographic Project test and that gives his
paternal line as R-M343 (of which R-M269 is a subclade).
On 28 Nov 2015, I finally persuaded the Waldron project
administrators to look again at the grouping of project members
and to assign myself and my known first cousin once-removed to the
same group, which they still describe in the old notation
as R1b1a2. This was probably equivalent when the group name
was assigned to R-M269, but, if so, two new SNPs upstream from
M269 have since been discovered and R-M269 has become R1b1a1a2 on
the 2017 ISOGG haplotree. The
old-fashioned R1b1a1a2-type descriptors no longer appear on
the FTDNA haplotree.
As of 8 Dec 2015, the Waldron project members had been arranged
by the administrators into four groups: three Waldrons in I1 (all
with predicted haplogroup I-M253); one Buso in J2 (predicted
haplogroup J-M172); two ungrouped; and the remaining 14 in R1b1a2,
including myself. 12 of these have predicted haplogroup R-M269,
one has confirmed haplogroup R-L20 (which is a subgroup of the
R-M269 group; see below) and
I have confirmed haplogroup R-FGC29367. Note that project members
can seem to disappear and later reappear from day to day depending
on whether you look at the results when not logged in (or timed
out), when logged in as a kit which is a project member, when
logged in as a kit which is not a project member, when logged in
as administrator of the project, or when logged in as
administrator of another project. This is determined by each
individual project member's selected privacy settings.
As of 8 December 2015, when my own Y-DNA haplogroup was
confirmed, only two other members of the Waldron Surname DNA
Project had a confirmed haplogroup, namely a Waldron in R-L20 and
a Phillips in R-DF23.
It is possible to order individual SNP tests
from FamilyTreeDNA at USD39 each (and more cheaply from YSEQ), but
I had not been able to figure out from online sources which ones I
should order when Joss Ar Gall of ISOGG at the FTDNA stand at
Genetic Genealogy Ireland 2015 taught me more in a few minutes
about my own Y-DNA than I had learned in several years of reading
web pages and attending lectures.
Joss's advice was to look at my Y-DNA matches and sort them (twice) by
Terminal SNP. This revealed nine matches with identified Terminal
SNPs, one a "35/37" match, two "34/37" matches, and six "33/37"
matches. The terminal SNPs were L148, L48, two M269s, U106, Z11,
Z343, Z383 and Z8. My closest STR match ("35/37") of those with
identified Terminal SNPs has terminal SNP Z383 which did not
appear on the Haplogroup R page as of 18 Oct 2015.
Having looked at these results, Joss advised me to join the U106
Project at FTDNA and consult the project co-administrators.
Mike Maddi sent this advice on Sunday 18 Oct 2015:
"looking at his 37 STRs, I think it's very likely that he's U106+
and just about as likely that he's Z8+, which is downstream from
U106. I base that on his results for DYS390, DYS447, DYS464d and
H4. His results for those markers match the clear modal values
found in Z8. If Patrick hasn't ordered the new Z8 SNP pack yet, he
should do so. (It just became available on Thursday.)"
After a lot of searching, I found the order form for SNP packs. The only pack that
it offers me is the R1b-M343 Backbone SNP Pack.
So I sought further advice on where to find an order form for the
Z8 SNP pack and got this from Mike:
"To order the Z8 SNP pack, log into your FTDNA account and click
on the blue "Upgrade" button in the upper right corner of the
page. On the page you're sent to, look for the box labeled
"Advanced Tests" and click on the blue "Buy Now" button. You'll be
sent to a page with a pull down menu on the left side labeled
"Test Type" - choose "SNP Pack" from the menu that's revealed.
You'll see the Z8 SNP pack as the last one on the list. Click on
the "Add" link for that test and follow the directions for
completing the purchase."
The Z8 SNP pack results were scheduled to arrive by 23 Dec 2015.
I looked for them on 8 Dec 2015 and found that they had been
waiting for me since 3 Dec 2015! The bottom line was "Your
Confirmed Haplogroup is R-FGC12057. Haplogroup R-U106 is the
descendant of the major R-P25 (aka R-M343) lineage and is found
from Eastern Europe to its highest frequency in Central Europe and
the British Isles."
FGC12057 is also known as Y30001.
The 95% confidence interval for the time to the most recent common
ancestor is from 1450 years ago to 3100 years ago (as of 2015).
My Big Y-700 results subsequently moved me town the haplotree
from R-FGC12057 to the more recent R-FGC29367.
Having found a known relative at last via Y-DNA testing on 14 Dec
2014, I put out an appeal to the Waldron Clan facebook page and group for other Waldrons to order kits and
join the project. I presume that the basic Y-DNA37 product is the
best starting point for every Waldron at this stage, but would
welcome advice on whether and when people should be advised to
order individual SNP tests in addition to or in place of the
Y-DNA37 product.
I was the second member of the Waldron Surname DNA Project to purchase a
SNP product. The following table shows the subclades to which
myself and my fellow pioneer belonged, with the defining SNPs for
each subclade:
| P J M
Waldron |
129522 |
| SNP |
Haplogroup |
SNP |
Haplogroup |
| M207 |
R |
M207 |
R |
| P241 |
R1 |
P241 |
R1 |
| M343 |
R1b |
M343 |
R1b |
| L389 |
R1b1 |
L389 |
R1b1 |
| P297 |
R1b1a |
P297 |
R1b1a |
| M269/L483/L150 |
R1b1a2 |
M269/L483/L150 |
R1b1a2 |
| L23 |
R1b1a2a |
L23 |
R1b1a2a |
| L51 |
R1b1a2a1 |
L51 |
R1b1a2a1 |
| L151/P311 |
R1b1a2a1a |
L151/P311 |
R1b1a2a1a |
| U106 |
R1b1a2a1a1 |
P312 |
R1b1a2a1a2 |
| Z381 |
R1b1a2a1a1c |
U152 |
R1b1a2a1a2b |
| Z301 |
R1b1a2a1a1c2 |
L2 |
R1b1a2a1a2b1 |
| L48 |
R1b1a2a1a1c2b |
Z367 |
R1b1a2a1a2b1a |
| Z9 |
R1b1a2a1a1c2b2 |
L20 |
R1b1a2a1a2b1a1 |
| Z30 |
R1b1a2a1a1c2b2a |
|
|
| Z2 |
R1b1a2a1a1c2b2a1 |
|
|
| Z7 |
R1b1a2a1a1c2b2a1a |
|
|
| Z8 |
R1b1a2a1a1c2b2a1a1 |
|
|
| Z11 |
R1b1a2a1a1c2b2a1a1a |
|
|
| Z12 |
R1b1a2a1a1c2b2a1a1a1 |
|
|
| Z8175 |
R1b1a2a1a1c2b2a1a1a1 |
|
|
| FGC12057 |
R1b1a2a1a1c2b2a1a1a1 |
|
|
Note that the nomenclature of the subclades is subject to annual
revisions as more SNPs are identified. The table above is based on
the 2015 nomenclature.
My fellow Waldron pioneer and I belong to different subclades of
R1b1a2a1a, also known as R-L151. According to YFull,
the 95% confidence interval for the Time to Most Recent Common
Ancestor (TMRCA) for two people who are L151 positive is from
4,400 to 5,300 years, long before the adoption of surnames.
The commonest Y-DNA haplotypes and terminal SNPs identified in
Ireland are also from subclades of R1b1a2a1a and are listed in the
following table:
| 2015 subclade |
Terminal SNP |
Name |
| R1b1a2a1a2c |
L21 |
|
| R1b1a2a1a2c1 |
DF13 |
|
| R1b1a2a1a2c1a1a1 |
M222 |
North West Irish/Irish Type I |
| R1b1a2a1a2c1c1b |
CTS4466 |
South Irish/Irish Type II |
| R1b1a2a1a2c1f2a |
L226 |
Dalcassian/Irish Type III |
| R1b1a2a1a2c1g1a1 |
L362 or L362.2 |
Munster Type I |
One of the longest documented male line lineages in Ireland is
that from Brian Boru (d. 1014), Dalcassian High King of Ireland,
to the present Lord Inchiquin, Conor O'Brien, whose subclade of R-L226 is
R1b1a2a1a2c1f2a1a1a or R-YFS231286 or R-Y6913. See kit 29355 at
the O'Brien Y-Chromosome DNA Surname Project.
Surname projects are only one of three quite different ways of
identifying close male-line relatives:
- looking for people with the same surname or a similar surname,
for example in the Waldron Surname DNA Project as I have done
above or Walden Y-DNA Surname Project;
- looking for people with similar STR markers and confirmed
terminal SNPs, for example in your Y-DNA37 match list; and
- looking for people with similar SNP markers, for example in
the R U106 (R1b-U106) (and subclades) project.
The following table shows my connections to various people that I
have identified from all three sources:
| Source |
Kit no. |
Surname |
"Genetic
distance" |
Most distant known
ancestor |
Terminal SNP |
Haplogroup |
| Y-DNA37 |
|
Boswell |
34/37 |
[BLANK] |
M269 |
R1b1a2 |
| Y-DNA37 |
|
Taylor |
33/37 |
John Taylor 1627 ENG - 1702 VA |
M269 |
R1b1a2 |
| Waldron project |
N41617 |
Waldron |
12/12 |
Thomas Waldron (c1825/6 Roscommon-1902 Limerick) |
M269 (predicted) |
R1b1a2 |
| Y-DNA37 |
|
Cottrell |
33/37 |
Richard N Cottrell, b.1794, Clun, Salop, England |
U106 |
R1b1a2a1a1 |
| Y-DNA37 |
|
Braden |
33/37 |
[BLANK] |
L48 |
R1b1a2a1a1c2b |
| Y-DNA37 |
|
Cantley |
34/37 |
Alexander Cantley |
Z8 |
R1b1a2a1a1c2b2a1a1 |
| Y-DNA37 |
|
Watkins |
33/37 |
Issacs Watkins, b. 1776 Caswell County, NC |
Z11 |
R1b1a2a1a1c2b2a1a1a |
| Myself |
310654 |
Waldron |
37/37 |
Thomas Waldron (c1825/6 Roscommon-1902 Limerick) |
Z12>Z8175>FGC12057>Z383>FGC29367 |
R1b1a2a1a1c2b2a1a1a1 |
| Y-DNA37 |
|
Morganstein |
35/37 |
[BLANK] |
Z12 > Z383 |
R1b1a2a1a1c2b2a1a1a1 |
| U106 project |
313521 |
|
31/37 |
Closest Big-Y Surname Match: BEATTIE |
Z12 > Z8175> FGC12057 |
R1b1a2a1a1c2b2a1a1a1 |
| U106 project |
61021 |
|
31/37 |
John Gibson, DOB 1580 - Dysart, Scotland |
Z12 > Z8175> FGC12057 |
R1b1a2a1a1c2b2a1a1a1 |
| U106 project |
193127 |
|
27/37 |
Andrew Beatty, m. 1789, Kilskeery, Tyrone |
Z12 > Z8175> FGC12057 |
R1b1a2a1a1c2b2a1a1a1 |
| Y-DNA37/U106 project |
13318 |
Crisp |
33/37 |
Chesley Crisp, b.c. 1805, North Carolina, USA |
L148 |
R1b1a2a1a1c2b2a1a1a1a |
| Y-DNA37 |
|
Weaver |
33/37 |
John Williams c1700 Brunswick,VA-1763 Brunswick,VA |
Z343 |
R1b1a2a1a1c2b2a1a1b2a |
| Waldron project |
129522 |
Waldron |
23/37 |
CHARLES A.WALDRON c.1820-New York City NY L20* |
L20 |
R1b1a2a1a2b1a1 |
There are only two other Waldrons besides myself in this table:
- my known first cousin once removed, who has bought only the
old Y-DNA12 STR product and has bought no SNP product; and
- the only other Waldron member of the Waldron project with a
confirmed haplogroup.
I appear to have many male-line relatives in the FTDNA Y-DNA
database with different surnames who are more closely related to me
than my fellow Waldron pioneer is.
There seems to have been some disagreement about the SNPs under
Z12, leading inevitably to confusion.
- FTDNA lists three SNPs on the next generation, namely Z383,
Z8175 and A5616. I was once presumed negative for Z383
(and tested negative for L148 under that); tested positive for
Z8175 (and tested positive for FGC12057 under that) and tested
negative for A5616:

- The U106 Tree by the U106 project
administrators lists only two of these three SNPs on the next
generation, namely Z8175 and A5616. The grouping in the
U106 project appears to list Z383 two generations further down
than FTDNA, under FGC12057 which is still under Z8175.
L148 is also two generations further down, still under Z383. The
notes to the U106 Tree suggest that Z383 is of dubious quality
and that families are getting mixed results (some positive/some
negative).
- The ISOGG folks list only L148 under Z12 and don't mention
Z383 or Z8175 or FGC12057 or A5616:

I tested negative for four further SNPs under FGC12057, namely
S18890, FGC12058, A687 and S7297.
The U106 project administrators list various further SNPs under Z12,
including A574, FGC29368, S7297, CTS4569 and FGC12059.
The U106 project (as of 23 December 2015) has myself and three
others listed with confirmed haplogroup R-FGC12057, but has grouped
22 other people under FGC12057, with confirmed haplogroups that
appear to be both upstream and downstream:
- upstream haplogroups: R-U106 (1 person), R-Z8 (1 person),
R-Z12 (5 people);
- debateable haplogroups: R-Z383 (1 person), R-L148 (5 people);
- downstream haplogroups: R-S18890 (3 people), R-FGC12058 (3
people), R-A687 (2 people) and R-S7297 (1 person).
I was not surprised when my Big Y-700 results should that I am
positive for Z383 as FTDNA's "presumed negative" long appeared to be
questioned by the U106 administrators.
I didn't find any enlightenment in the discussion of the placement of Z383 on the U106
mailing list.
TiP Calculator
I am sceptical of the TiP calculator, which estimates the
probability that the most recent common ancestor of two Y-DNA
matches is within any number of generations.
These estimated probabilities depend on the genetic distance
between the two men, the mutation rates of the particular markers
at which they differ, and the number of known generations of male
line ancestors of each man.
However, I don't think that the TiP calculator takes any account
of the number of matches reported, of the surnames of the men
being compared and of their matches, or of the locations where
their known ancestors lived.
If the men being compared have similar surnames and known
ancestors from the same location, then the most recent common
ancestor is probably closer than suggested by the TiP calculator.
On the other hand, if the men being compared have different
surnames and their known ancestors lived far apart, then the most
recent common ancestor is probably further back than suggested by
the TiP calculator.
Similarly, someone from a dynasty which has many more matches
than average, with many more surnames than average amongst those
matches, probably has many fewer mutations than average, so the
most recent common ancestor of two people from that dynasty is
probably more distant than predicted by a model that seems to
ignore this information.
I tend to use the TiP calculator to come up with a 95% confidence
interval for the number of generations to the most recent common
ancestor; I know that others look at the 50% probability cut-off
or median number of generations to MRCA.
Bearing all these caveats in mind, it is interesting to look at
what perfect STR matches tell us about the number of generations
back to the MRCA.
At 0/37, the upper bound of the 95% confidence interval is
between 6 and 7 generations.
At 0/67, the upper bound of the 95% confidence interval is between
5 and 6 generations.
At 0/111, the upper bound of the 95% confidence interval is
between 3 and 4 generations.
In these cases, an STR upgrade can be viewed as giving a more
precise estimate of the number of generations to the MRCA. The
37-67 upgrade moves the MRCA one generation closer if no
additional mutation is discovered (and can move the MRCA further
back if additional mutations ARE discovered).The 67-111
upgrade moves the MRCA two generations closer if no additional
mutation is discovered (and can also move the MRCA further back if
additional mutations ARE discovered).
In one example that I have studied, one additional mutation in
the last 44 STR markers left the upper bound of the 95% confidence
interval between 5 and 6 generations.
Grouping Project Members
There are FTDNA projects based around surnames, around geographic
locations and around observed Y-DNA results.
I administer or co-administer several such projects, both
geographic-based (including the Clare Roots project) and surname-based
(including the Clancy project, Durkin project, Marrinan project and O'Dea project).
I am almost entirely self-taught as regards project administration,
but I suspect that most of my fellow administrators find themselves
in a similar situation. There is a Facebook group for ONLY FTDNA Project Administrators to which we
can turn for advice.
The Clare Roots project is for those with ancestors in one of the 32
Irish counties. It would be nice to have a similar project for every
county, but the list on the ISOGG Wiki is growing only slowly.
Project administrators are expected to assign male project members
who have bought Y-STR products into subgroups in which they appear
on the Y-DNA Colorized chart for the relevant project, e.g. the Clare Roots project. These charts have a row
for every member of the project and a column for each of the 111 STR
markers. There are additional columns showing the row number; the
FTDNA kit number; the member's surname; the details supplied by the
member of his most distant known male line ancestor; and the
haplogroup or most recent SNP either predicted (in red) or confirmed
(in green) by FTDNA. The colorized chart supercedes the Y-DNA Classic Chart, which is still available.
The colorized chart has additional rows showing the min, max and
mode for each subgroup; difference from the mode in a subgroup are
colorized according to this color scheme.
I was prompted to add this subsection after a fellow project
administrator asked me to help him to understand how to group the
STR results of the members of his geographic project, having found
that extensive reading on the subject left him "none the wiser as to
how to sort the STR data of the project members into their
haplotypes/haplogroups/Terminal Haplogroups/Terminal SNPs (all very
confusing jargon used differently)". I hope that the following
information may help administrators to understand how they can most
usefully group the results for display on the project Y-DNA
Colorized Charts (e.g. for Clare or Kerry or Kilkenny).
The main objective of analysing a man's Y chromosome is to find
the lowest (i.e. most recent) SNP on the haplotree for which he is
positive, or likely to be positive.
There are several ways of doing this:
- the big bang approach - buy the Big Y-700
- selective purchasing of SNP packs and individual SNPs, guided
by STR results
- educated guesswork based on examining the confirmed SNPs of
his closest STR matches
Project administrators can help with this process and can group
project members according to their confirmed and suspected SNPs.
They have the advantage of being able to see intra-project matches
just outside the thresholds shown directly by FTDNA to its customers
(7/37 instead of 4/37; 25/67 instead of 7/67 and 40/111 instead of
10/111).
As project membership grows, it becomes easier to see how project
members are related to each other.
Project administrators are provided with an online editor for member subgroups. This so-called
"editor" is rather tedious when one has created dozens of subgroups
and wishes to make systematic changes to all the subgroup names or
colours, as it has no search-and-replace facility.
Subgroup Names (which are visible on the results pages) appear to be
truncated at 161 characters, without warning. So keep these names as
short as possible with no unnecessary spacing or punctuation.
Subgroup Descriptions (which are visible to the project
administrator(s) only) appear to be truncated at 973 characters,
without warning, and despite the false assurance of scroll bars in
the editor.
When I become aware of a new project member with Y-DNA results or an
existing project member with new Y-DNA results, I follow this
procedure:
- Open the genetic distance report
- Login to my project administrator account if not already
logged in
- Use Ctrl-F in my browser to find the word "ungrouped" if I am
dealing with a member whom I have not yet assigned to a subgroup
- Copy the member's kit number and create a row for him in the
offline spreadsheet in which I keep my notes on project members,
including columns for the following:
- Kit no.
- Surname
- Y-DNA products purchased
- Terminal SNP according to FTDNA
- Most recent SNP predicted by myself
- Date analysed
- Number of STR matches visible to the member
- Number of intra-project matches visible to me as
administrator
- Comments
- Right-click the kit number and open the member's dashboard
page in a new tab, check how many STRs he has purchased (37, 67
or 111) and open his Y-DNA match list
- Go back to the genetic distance report and select the
appropriate number of markers from the dropdown menu
- Click the arrow beside the member's kit number to start
generating the report, which may take a few minutes
- While waiting:
- In a third tab, open the FTDNA haplotree: https://www.familytreedna.com/my/y-dna-haplotree?ekit=j0XmKW8S87H%2ffjy92CTXbQ%3d%3d
(The ekit identifier at the end of the URL is for myself;
when you bookmark this link, you will have to change it to the
ekit identifier for a kit in a project that you administer,
probably your own kit.)
- If the member's Terminal SNP is new to the project, copy and
paste the SNP identifiers for his line of descent from the
haplogroup root into a string, which in many cases will be the
name of the subgroup to which he will be assigned, e.g.
R-M269>L23>L51>L151>P312>Z290>L21>DF13>ZZ10_1>Z253>Z2534>FGC5618>L226>FGC5660>ZZ31_1>FGC5628
- Look at the man's STR matches and their terminal SNPs and
type a brief summary in the comments column of the spreadsheet
- Look at the man's intra-project matches and the subgroups to
which they have been assigned and again type a brief summary in
the comments column of the spreadsheet
- Now I am in a position to make an educated guess as to which
branch of the haplotree and which subgroup within my project the
man may belong, using:
- his own confirmed SNPs, if any;
- the most recent common ancestor of the terminal SNPs of his
own closest STR matches;
- the most recent common ancestor of the subgroups to which I
have already assigned his closest intra-project matches; and
- the subgroups to which I have already assigned project
members with the same or similar surnames.
- Open my project results page in a fourth tab and check whether
I need to create a new subgroup or reassign existing project
members to different subgroups
- Open the editor for member subgroups in a fifth tab
and create the new subgroup and/or move members around as
necessary
There are a few tricks which I have learned along the way when
dealing with men from haplogroup R-M269, by far the most prolific
haplogroup in Ireland and in County Clare:
- FTDNA will never predict anything below R-M269 without the
purchase of a SNP product, but it is often easy for project
administrators to make more precise predictions with some
confidence.
- The multi-part STRs in the first 37 form a good predictor for
membership of R-L226 (Irish
Type
III), in which there are distinctive values of DYS459
(8-9) and DYS464 (13-13-15-17).
- The ISOGG Wiki suggests that if Y-DNA67 is
available and R-M269 is predicted, then P312 and U106 (to which
I belong) can be distinguished by the 66th marker, DYS492 (12
for 95.1% of P312; 13 for 96.0% of U106).
- STR comparisons do not really help to distinguish between
subclades of R-FGC5660 (to which almost every member of R-L226
belongs) or R-M222.
Many of the colours available for distinguishing subgroups don't
work very well, or at least my eyesight isn't good enough to use
them, as the background colours are too close to the text colour. I
used this colour scheme in all my projects when colours were chosen
by name, rather than by selecting coloured dots from a grid without
names for the various shades:
- Each top-level haplogroup represented in the project has its
own colour, so far comprising:
- E (Lime)
- G (Light Blue)
- I (Beige)
- J (Aqua Marine)
- Q (White)
- R (Light Grey)
- Within haplogroup R, there are also separate colours for
sub-branches:
- R1a (Pink)
- the four main Irish sub-branches:
- R-M222 (Green Yellow) is North West Irish/Irish Type I and
subclades
- R-CTS4466 (Plum) is South Irish/Irish Type II and
subclades
- R-L226 (Coral) is Dalcassian/Irish Type III and
subclades
- R-L362 (Orchid) is Munster Type I and subclades
- the rest of R-L21 (Yellow)
- R-U106 and subclades (Light Cyan).
I used to monitor the ISOGG haplotree as well as the FTDNA haplotree
and include the ISOGG haplogroup labels in my subgroup names, but
both are now changing so rapidly that this is no longer practical. I
do still monitor Alex
Williamson's Big Tree, which was originally only for those who
are in R-P312, but subsequently expanded to include
those like myself who are in R-U106, although the website text had not been
updated to reflect this as of 9 February 2019.
Maurice Gleeson has also written extensively about Criteria for Grouping People into Y-DNA Genetic
Families, more from the perspective of a surname project than
a geographic project.
New branches of the
haplotree
Some men will find that none of their Y-DNA STR matches has a
confirmed SNP, particularly if the number of STR matches is small.
If they are lucky, they will find that some of these matches without
confirmed SNPs have the same or similar surnames.
In this case, a group of men with similar surnames who are STR
matches to each other can get together, collaborate and pool their
funds as they try to identify SNPs for which they may be positive.
If everyone in the group is a member of a relevant surname or
geographical project, then donating to the project, with the
co-operation of the project administrator, is probably the
simplest way of pooling funds.
The initial options in this case will usually be to choose one
candidate from the group and order Big Y-700 or a high-level
SNP pack on his kit. If one of the group is willing to do Big Y-700
(USD649 as of 9 February 2019), then there is no point in wasting
money on a SNP pack or SNP packs.
If Big Y-700 is considered too expensive, the cheaper alternative is
for one of the group to buy a high-level SNP pack (USD119). For
example, if the predicted terminal SNP is R-M269 and one of the
group has bought Y-DNA67, then the R1b - P312 SNP Pack would be
recommended if the value of the 66th marker DYS492 is 12 and the R1b
- U106xZ18xZ156xL48 SNP Pack would be recommended if the value of
the 66th marker DYS492 is 13.
When the Big Y-700 or SNP pack results come back with a terminal SNP
for one kit, then the other members of the group can order the
single SNP test for that SNP (USD39).
The Big Y-700 will return a list of novel variants that have the
potential to be declared SNPs in future. If two members of the
group do Big Y-700, then there is the potential for finding a shared
novel variant which might immediately be declared a SNP. The
best candidate for the second Big Y-700 is usually the person who
appears to be at the greatest genetic distance from the first
tester. But it may be possible to identify any such new SNP for half
the cost by relying on Alex Williamson's follow-up analysis at http://ytree.net/
The chances are that after ordering a high level SNP pack, the
follow-up advice would be to order another downstream SNP pack to
find a more recent terminal SNP, so the choice may be between one
man spending USD238 for two SNP packs versus each of two spending
USD324.50 for a shared Big Y-700.
What to do
when your Big Y-700 results appear
The equivalent of using www.GEDmatch.com to get more
out of your Family Finder results is to to use The Big Tree at
ytree.net to get more out of your Big Y-700 results.
You should follow the instructions at
https://www.ytree.net/Instructions.html
to copy your Big Y-700 results to The Big Tree. If you wish,
you can allow a project administrator to whom you have given
advanced access to your kit to do the transfer on your behalf.
In due course, you will then appear in the relevant block of the Big
Tree, for example at
https://www.ytree.net/DisplayTree.php?blockID=155
Most people seem to find The Big Tree display much more intuitive
than the FTDNA display, and sometimes there are interesting
differences in the interpretation of the results.
You may find that you have unnamed variants in common with other men
in your match lists or in your projects who have also bought Big
Y-700 and have the same most recent confirmed SNP as you do.
For example, two men with Big Y-700 results giving both the most
recent confirmed SNP R-A933 shared these unnamed variants after the
second man's Big Y-700 results appeared:
16105334 C A
20303791 C T
9975629 T G
It is not clear whether, when or by whom these shared unnamed
variants may be recognised as newly discovered, and possibly
surname-specific, SNPs. Some of the more experienced project
administrators from whom I have been trying to learn may be able to
explain this process.
These potential or confirmed new SNPs will be of great interest to
other men with the same surname and the same most recent
confirmed SNP. They will hopefully want to test for these mutations
in due course, either by having them made available as single SNP
tests at FTDNA or by using yseq.net.
Interpreting X-DNA results
Recombination
According to Jim
Owston:
a man may inherit his X as one of his mother’s two
X-chromosomes completely intact; however, it is more likely he
will receive a recombined X that includes segments from each of
his mother’s two Xs.
The same remark about recombination applies also to a woman's
maternal
X chromosome; her paternal X chromosome is a copy of her father's
single X chromosome, so is not subject to any recombination.
As I am a male, my single X chromosome is a combination of my
mother's two X chromosomes. Anywhere between 0% and 100% of that
recombined X chromosome comes from my maternal grandfather and the
remainder from my maternal grandmother.
Roberta Estes says,
without linking to any source, that:
a complete X chromosome ... is comprised of 18092 SNPs and is
195.93cM in length, barring anomalies like read errors and such,
which do periodically occur.
Taking this length in cM and assuming that recombination follows
a Poisson process (i.e. that successive recombinations are
independent events), the distribution of the number of crossovers
on one X chromosome in one generation is:
| #crossovers |
probability |
| 0 |
14.1% |
| 1 |
27.6% |
| 2 |
27.1% |
| 3 |
17.7% |
| 4 |
8.7% |
| 5 |
3.4% |
| 6 |
1.1% |
| 7 |
0.3% |
| 8 or more |
0.1% |
In a small sample of five, using data from Matt Dexter, Roberta
finds one instance of transmission without recombination. She
expresses herself "staggered" that, in another study by Robert
Paine with 21 people, 25% of participants show no recombination on
the X chromosome. Five successes in 21 binomial trials with a
success probability of 14.1% in each trial is not significantly
different from the expected 2.96 successes. Perhaps I should
express this result in terms of failures rather than successes, as
those anticipating recombinations and not finding them may
consider their absence to be a failure. On the other hand, those
of us who want to know exactly where our X-DNA came from will
probably get excited by the discovery that there was no
recombination, eliminating a whole branch of our ancestry as a
potential source of X-DNA, and consider this a success!
Roberta also shows a screenshot from the 23andMe chromosome
browser, suggesting that the fact that individuals from different
generations are half-identical throughout the X chromosome is
evidence of transmission without recombination. As with the
autosomal chromosomes, parent and child will always be
half-identical throughout the X chromosome, regardless of
recombination.
We have seen in an earlier table that only
the first five autosomal chromosomes are longer in terms of cM
than the X chromosome; thus the last 17 autosomal chromosomes have
a probability higher than 14.1% of being transmitted without
recombination (again making the assumption of independence so that
the Poisson distribution applies). As can also be seen in the
chromosome browser or the Wikipedia
table, on the base pair scale the X chromosome is longer
than all bar seven of the autosomal chromosomes.
Elsewhere,
Roberta says
I really do suspect that [the X chromosome is] recombining less
frequently than the ... autosomes.
She actually appears to suspect either that the accepted length
in cM of the X chromosome is wrong, or that recombinations are not
independent, so that the Poisson distribution misrepresents the
distribution of crossovers.
While, as a male, my single X chromosome comes entirely from my
mother, it includes a contribution from at least one ancestor in
every generation beyond my mother, and parts of it almost
certainly come from two or more ancestors in more remote
generations. Only by comparing DNA test results can I figure out
with whom I share all or part of my X chromosome. If enough
potential X cousins, as they might be called, submit DNA samples
for analysis and upload their data to gedmatch.com to permit X
chromosome comparisons, and if there is enough diversity among
their X chromosomes, then it may be possible to narrow down the
potential sources of my own X chromosome to less than the
theoretical maximum number of ancestors, in my grandparents'
generation and beyond.
For autosomal DNA, a segment of, say, 10cM, is equally likely to
have come down unbroken from any of the ancestors in a given
generation, say from each of my eight greatgrandparents. This does
not apply to X-DNA, for which the number of opportunities for
recombination in the inheritance path depends not on the number of
generations in the path but on the number of females in the path.
If we let M denote male ancestors and F denote female ancestors,
then the inheritance path to an ancestor can be described by a
string of Ms and Fs, for example MFF for a man's maternal
grandmother or FMFM for a woman's father's maternal grandfather.
The expected proportion of one's X-DNA inherited from a
particular ancestor is 0 if there are two consecutive Ms in the
inheritance path, and otherwise 2-f, where f
is the number of Fs in the path excluding the last letter.
From my father (MM), I (as a male) inherit no X-DNA.
From my mother (MF), I inherit 20=1 or 100% of my
X-DNA.
For any ancestor on my paternal side, the inheritance path begins
MM... so I inherit no X-DNA.
From each of my maternal grandfather (MFM) and my maternal
grandmother (MFF), I expect to inherit 1/2 of my X-DNA.
From my matrilineal greatgreatgrandmother (MFFFF), I expect to
inherit 1/8 of my X-DNA, but I expect to inherit exactly the same
percentage from a far more distant ancestor with inheritance path
MFMFMFMF.
Conversely, the typical X-DNA segment of, say, 10cM, is equally
likely to have come down unbroken from these two ancestors three
generations apart with different inheritance paths.
Similarly, an X-DNA segment of, say, 10cM, is far more likely to
have come down unbroken from an X-ancestor on a given distant
generation than an autosomal DNA segment of the same length. The
exception to this is the matrilineal X-ancestor in the given
generation, whose X chromosomes are subject to recombination in
every generation.
Finding the paper trail to explain the source of a shared X-DNA
segment will therefore on average be more difficult than finding
the paper trail to explain the source of a shared autosomal DNA
segment of the same length.
In other words, the closeness of an X match cannot be thought of
in standard cousin terms. A father passes on his X unchanged to
his daughters, but a mother passes on a recombination of her two
Xs to all her children. So the distribution of the amount of X
shared by two people depends only on the number of females on the
path between the two people in the family tree. For example, two
male third cousins whose mothers' PATERNAL grandmothers were
sisters are expected to share more X-DNA than two male third
cousins whose mothers' MATERNAL grandmothers were sisters, because
there is one less recombination on each side. In the first case,
the path to the common greatgreatgrandmother for both third
cousins is MFMFF and in the second case it is MFFFF. Draw yourself
a little relationship diagram if you don't follow!
This difficulty is both exacerbated and simplified by the
inheritance path of surnames: exacerbated because the surname
follows the X-DNA for at most two generations (father's surname
and daughter's maiden surname; or mother's married surname and
daughter's maiden surname); but simplified if two people sharing
X-DNA find that they also share an ancestral surname (there are
only two generations where the surname inheritance path crosses
the X-DNA inheritance path). For example, I share X-DNA with
someone who has a Walsh ancestor. My own matrilineal
greatgreatgrandmother may have been a Walsh (this remains
unproven). If our shared X-DNA comes through these Walshes, then
my "match" must descend from my possible GGGGgrandmother Mrs.
Walsh. This is just too far back to be sure that we would also
share autosomal DNA (which we don't).
These X inheritance paths have their advantages as well as their
disadvantages.
For a mitochondrial or matrilineal ancestor, the proportion of
her X-DNA which a descendant is expected to inherit is the same as
the proportion of her autosomal DNA which the descendant is
expected to inherit. Thus the ratio of expected cM of autosomal
DNA inherited to expected cM of X-DNA inherited is the same as the
ratio of the total cM length of the autosomes to the total cM
length of an X chromosome: 3587.1/195.9 or approximately 18.3:1.
For an X ancestor with one male on the line of descent, the
proportion of the ancestor's X-DNA inherited by a descendant (male
or female) is twice the proportion of the same ancestor's
autosomal DNA inherited by the same descendant; thus the ratio of
expected cM inherited is half the figure for the matrilineal
ancestor, or approximately 9.2:1. Similarly, with two males in the
inheritance path, the autosomal:X ratio drops to 4.6:1, and so on,
until with five males in the path the ratio becomes 0.6:1, and we
can expect to find more X-DNA than autosomal DNA inherited from
that particular ancestor.
This explains why GEDmatch.com often shows matches sharing
substantial segments of X-DNA but no autosomal DNA. Unfortunately,
the FTDNA matching algorithm ignores X-DNA, so does not report
those who share large segments of X-DNA but not autosomal DNA. I
have written about a great example of this here.
One can actually take advantage of this quirk when selecting
descendants to provide DNA samples for particular research
problems. For example, my GGGGgrandfather John Keas was one of
three men of similar age with that unusual surname (now generally
spelled Keyes) who held land in 1833 in Carrig in county Limerick.
I would like to test the hypothesis that the three men were
brothers. The first strategy that comes to mind is to find one
descendant of each Keas man, from the closest living generation to
the 1833 landholder in each case, and to look for half-identical
regions of autosomal DNA. In two cases (John Keas and William
Keas), there are many descendants from whom to choose; in the
third case (Michael Keas), we are still struggling to find a
single proven living descendant. Where there are many descendants
to choose from, and when economic circumstances dictate that DNA
samples from all of them cannot be submitted, then the possible
use of the X chromosome should be considered. An X-descendant with
an alternating male/female line of descent from one of the three
Keas men is expected to have inherited a much larger proportion of
the X-DNA of Mrs. Keas, the unknown hypothesised common mother of
the three men, than a direct female line descendant or any
descendant who is not an X descendant. So, when exploring the
family tree in search of candidates from whom to collect DNA
samples, concentrate on these alternating male/female lines.
For example, in the case of this Mrs. Keas, who was bearing
children by the late 1780s, there is a living GGGGgrandchild with
a FMFMFMF line of descent. She is expected to have inherited 1/8th
of each of Mrs. Keas's two X chromosomes, or about 49cM, but only
1/64th of Mrs. Keas's 44 autosomes, or about 112cM.
More importantly, if there is shared autosomal DNA, it could have
come from any of the 64 ancestors on Mrs. Keas's generation, but
shared X-DNA can come from only 21 of those 64 ancestors.
Finally, if the two subjects whose X-DNA matches are both male,
then it is certain that there is an identical segment, and not
just a region which is half-identical by chance because it is made
up of overlapping paternal and maternal segments.
Comparing X chromosomes
For men, matches on the X chromosome must come from the maternal
side. For women, matches on the X chromosome can come from either
the paternal or maternal side.
When comparing X-DNA results for two females, the same principles
apply as when comparing autosomal DNA results for two individuals
of any gender. Each female has two X chromosomes, and it is
possible only to identify half-identical regions or half/half
matches.
When comparing X-DNA results for two males, things are a lot
easier, since each has just one X chromosome, and it is possible
to unambiguously identify identical segments, or to find full/full
matches.
When comparing X-DNA results for a male with those for a female,
we are faced with a new complication, as the male has one X
chromosome and the female has two, so one can observe only
half/full matches.
Two individuals could share an identical segment on the X
chromosome without sharing one on any of the autosomal
chromosomes. Many autosomal comparisons show only one substantial
half-identical region, so there is no reason why the only such
region can not be on the X chromosome, particularly in the case of
a female-to-female comparison.
In a male-to-male X-DNA comparison, there is no danger of finding
half-identical by chance regions. In a female-to-female X-DNA
comparison, half-identical by chance regions are very possible.
The simplest comparison is between the single X chromosome of two
males. If matching segments are found, then there is a full/full
match, which has definitely not arisen by chance and is most
likely to have arisen by descent. For those males, like me, who
remain unconvinced that half-identical regions of autosomal DNA
are very likely to contain identical segments, male matches on the
X chromosome are a good place to start looking hard for
genealogical relationships with strangers.
Things get more complicated when comparing the single X
chromosome of a male with the two X chromosomes of a female. The
result may be a full/half match, in which the male's X chromosome
matches at least one of the female's X chromosomes throughout some
half-identical region. This may arise by chance or by descent.
Stronger conclusions can be drawn when comparing the single X
chromosome of a male with the four X chromosomes of two known
X-related females (who are not doubly related). If there is a
segment where the two females have a half/half match, then,
because there is evidence of a recent common X-ancestor, it is
extremely likely that the two females have matching segments in
that region. If the male has a full/half match with both females
in the same region, then it is extremely likely that their common
X-ancestor is also X-related to him.
Finally, comparisons can be made between two pairs of known
X-related females. Any segments where one of the X-related pairs
have a half/half match probably come from their most recent common
X-ancestor. If all four females are half/half matches with each
other on the same region, then it is extremely likely that the
most recent common X-ancestors of each pair were related.
Suppose that two sisters look at the half-identical regions on
the X chromosome that they share with a third person (male or
female).
If the third person matches the sisters' shared paternal X
chromosome, then both sets of half-identical regions will be the
same (unless the third person is related to the sisters on both
paternal and maternal sides).
The contrapositive of this statement is also true: if the two
sets of half-identical regions are different, then the third
person must be related to the sisters on their maternal side (or
merely half-identical by chance). This is because the maternal X
chromosomes inherited by the sisters from their mother are the
result of recombination, so only 50% of them are expected to be
the same. In other words, sisters' pairs of X chromosomes are
expected to be full-identical on half of their length and
half-identical everywhere they are not full-identical. Where they
are full-identical, they come from the same grandparents (paternal
grandmother and maternal grandfather or paternal grandmother and
maternal grandmother). Where they are half-identical, the maternal
X chromosomes come from opposite grandparents (one sister from
maternal grandfather and the other sister from maternal
grandmother).
Comparing autosomal DNA is just like comparing the X-DNA of two
females, with the additional complication that the source of the
shared DNA can be any ancestor, not just an X-ancestor.
Before any definitive conclusions can be drawn, both parties
needs to have not only their own DNA analysed, but also the DNA of
some half-related individuals - in other words, the DNA of any
relative other than a full-sibling or a double cousin.
So really this X-DNA chapter should come before the autosomal DNA
chapters.
FTDNA-X-Matches
As of 2 January 2014, FamilyTreeDNA added two new features:
- the ability to filter the list of FTDNA-overall-matches to
show only those which it terms X-Matches (for clarity, I will
use the term FTDNA-X-match); and
- the ability to see half-identical (or equivalent) regions of
the X-chromosome in the chromosome browser.
I have not yet found FTDNA's definition of X-Match. As of 25
January 2014, the FAQs
still report that:
the Family Finder test does not currently use X-chromosome DNA
(X-DNA) test results. The X-chromosome follows a different
inheritance pattern than your autosomal DNA. Therefore, it
requires a different matching algorithm to be accurate and
scientifically valid.
The Bioinformatics team is investigating the math and
programing for an accurate X-chromosome program.
Roberta Estes says,
without linking to any source:
The X matching criteria [sic] at Family Tree DNA is:
1cM/500SNPs.
All that I can report is the nature of my own first three
FTDNA-X-matches (as of 25 January 2014), which comprise two males
(6.93cM or 650SNP identical segment with one, 5.12cM or 575SNP
identical segment with the other) and one female (4.98cM or 550SNP
half-identical region, or full/half match, by some fluke almost
totally overlapping the identical segment with the first male).
Not yet having any known relative among my FTDNA-overall-matches,
these are the first confirmed segment matches of any sort that I
have found via FTDNA.
FTDNA apparently allows comparison of the X chromosomes of two
FTDNA-overall-matches, but not of those not deemed to be
FTDNA-overall-matches based on the autosomes.
GEDmatch-X-Matches
How does GEDmatch.com deal with autosomal match v. X match?
For one-to-one comparisons, regardless of gender, GEDmatch.com
presents a report beginning with a legend listing Base Pairs with
Full Match (green), Base Pairs with Half Match (yellow) and Base
Pairs with No Match (red). If both parties in the comparison are
male, the only possible results are Full Match and No Match, so
there will be no yellow regions.
Here's an example of a male v. male comparison, with a threshold
of 3cM and one fully matching segment above that threshold, of
4.6cM. The images appear to be generated on a SNP scale rather
than a cM or bp scale. Note the absence of yellow regions.


Here's an example of a male v. female comparison, again with a
threshold of 3cM, this time with two half-identical regions above
that threshold. Note the presence of yellow regions.


The
thresholds
to use for X comparisons depend on the genders involved. When
comparing two females (with two X-chromosomes each), use the
same thresholds as for autosomal comparisons. Use lower
thresholds when comparing a male (with one X-chromosome) to a
female (with two X-chromosomes). Then lower the thresholds
again when comparing two males (with one X-chromosome each).
Clearly, there is no way that an X match between two men can
be half-identical by chance (i.e. made up of overlapping
segments from maternal and paternal chromosomes), as
frequently happens with half-identical regions on the X
chromosome between two females and with half-identical regions
between autosomal chromosomes for any combination of genders.
For some bizarre reason, the GEDmatch one-to-one X comparison
is set to use the same default of 7cM whatever the genders
associated with the two kits being compared.
If
you
suspect that a kit has been uploaded to GEDmatch with the
gender misreported, probably the easiest was of checking this
is to look at the graphic for the one-to-one X comparison with
a known male kit. If there is no yellow region in the graphic,
then the suspect kit must be male; if there are yellow
regions, then the suspect kit must be female.
The gender bias
Because women have two X-chromosomes and men have only one, it is
inevitable that women have many more X-matches than men. Women
have twice as much X-DNA available for comparison with the same
database of potential matches, so one would expect a woman to have
on average just twice as many X-matches in the same database as a
man.
Roberta Estes says on
her
blog that the reason women have many more X-matches than men
is because women have so many more ancestors in the “mix”. This
statement strictly is not even true, let alone an explanation of
the gender bias. Although most people believe that human history
is finite, in any mathematical representation of that finite
history that we might use, both men and women ultimately have an
infinite number of X-ancestors. In each generation, the ratio of
the number of X-ancestors that a female has on that generation to
the number of X-ancestors that a male has on that generation
approaches the golden ratio,
approximately 1.6180339887... (the limit of the ratio between two
consecutive Fibonacci numbers). The expected number of matches for
a given amount of X-DNA found by searching a given database
depends only on the amount of X-DNA (one or two X-chromosomes) and
the size of the database, and not in any way on the number of
ancestors from whom that X-DNA might have been inherited, whatever
form of ancestor-counting is used.
The observed gender bias appears to be far larger than the 2:1
ratio that one would expect to find.
In my case, I have access to three FTDNA accounts, one male and
two females. I am male and have only three FTDNA-X-Matches out of
398 FTDNA-overall-matches (as of 25 January 2014) but one female
has 69 FTDNA-X-Matches out of 357 FTDNA-overall-matches and the
other has 48 FTDNA-X-Matches out of 416 FTDNA-overall-matches.
Similar discrepancies can be seen at GEDmatch.com, which shows
that in many cases two people can share more X-DNA than autosomal
DNA (on the cM scale).
As of 22 January 2014, I have only 20 GEDmatch matches by X-DNA
Total cM of longer than 9.1cM, of whom only 4 are male and with
only 6 of whom I share autosomal half-identical regions longer
than 7cM.
Anthea, on the other hand, based only on 23AndMe customers, has
20 GEDmatch matches by X-DNA Total cM of longer than 49.6cM, of
whom none are male and none share an autosomal half-identical
region longer than 7cM with her.
It is obvious from the X-DNA inheritance pattern that the
majority of X-DNA matches will be female, but 20 out of 20 is
still surprising.
The observed gender bias must arise instead from a preponderence
of half-identical by chance regions.
At GEDmatch.com, I recommend that males go to the 'One-to-many'
matches page and enter their kit number. In the X-DNA group of
columns, click the blue arrow in the largest cM column to sort by
that column. Look down the Sex column and note the Kit Nbr for any
M that you find. These are the men with whom you have identical
segments on the X chromosome and are worth investigating further.
In my own case, by using this approach I found five males
including myself who have identical segments of various lengths in
the region of the X chromosome between locations 23,955,089 and
36,111,764. Two are from FTDNA, two from 23andMe and one from
Ancestry. Of the other four, only the other FTDNA customer has
published an e-mail address, enabling us to establish contact.
However, his X ancestors cannot be traced out of the USA and
mine cannot be traced out of Ireland, so we have failed to
establish our precise relationship. I would love to hear from the
other three anonymous X matches whose GEDmatch Kit Numbers appear
in the table below.
As these are identical segments and not just half-identical
regions, all five men are very likely to share a common X
ancestor.
Here's a table showing the ten one-on-one matching segments
between these five men, identified by their GEDmatch kit numbers:
| Kit Nbr 1 |
Kit Nbr 2 |
Start |
End |
cM |
SNPs |
| A241230 |
F156355 |
23,955,089 |
32,690,504 |
12.7 |
1,302 |
| M223101 |
A241230 |
28,606,324 |
32,387,789 |
8.1 |
764 |
| M223101 |
F156355 |
28,606,324 |
32,387,789 |
8.1 |
773 |
| F310654 |
A241230 |
29,528,059 |
32,387,789 |
7.1 |
639 |
| F310654 |
F156355 |
29,528,059 |
32,387,789 |
7.1 |
666 |
| F310654 |
M223101 |
29,528,059 |
32,496,045 |
7.9 |
694 |
| F156355 |
M391301 |
31,333,265 |
32,387,789 |
3.8 |
322 |
| A241230 |
M391301 |
31,333,265 |
32,387,789 |
3.8 |
315 |
| M223101 |
M391301 |
31,333,265 |
32,493,780 |
4.6 |
520 |
| F310654 |
M391301 |
31,333,265 |
36,111,764 |
10.0 |
812 |
This table identifies eight crossover locations, viewing
32,493,780 and 32,496,045 as the same crossover for two reasons:
- there is 0cM between them; and
- between these locations, F310654 matches M223101 and F310654
matches M391301, but M223101 does not match M391301.
As the latter is impossible (since male/male X matching is transitive - unlike male/female or
female/female X matching), there must be some form of measurement
error in this tiny segment.
I needed this hand-drawn diagram in order to figure out what was
going on:
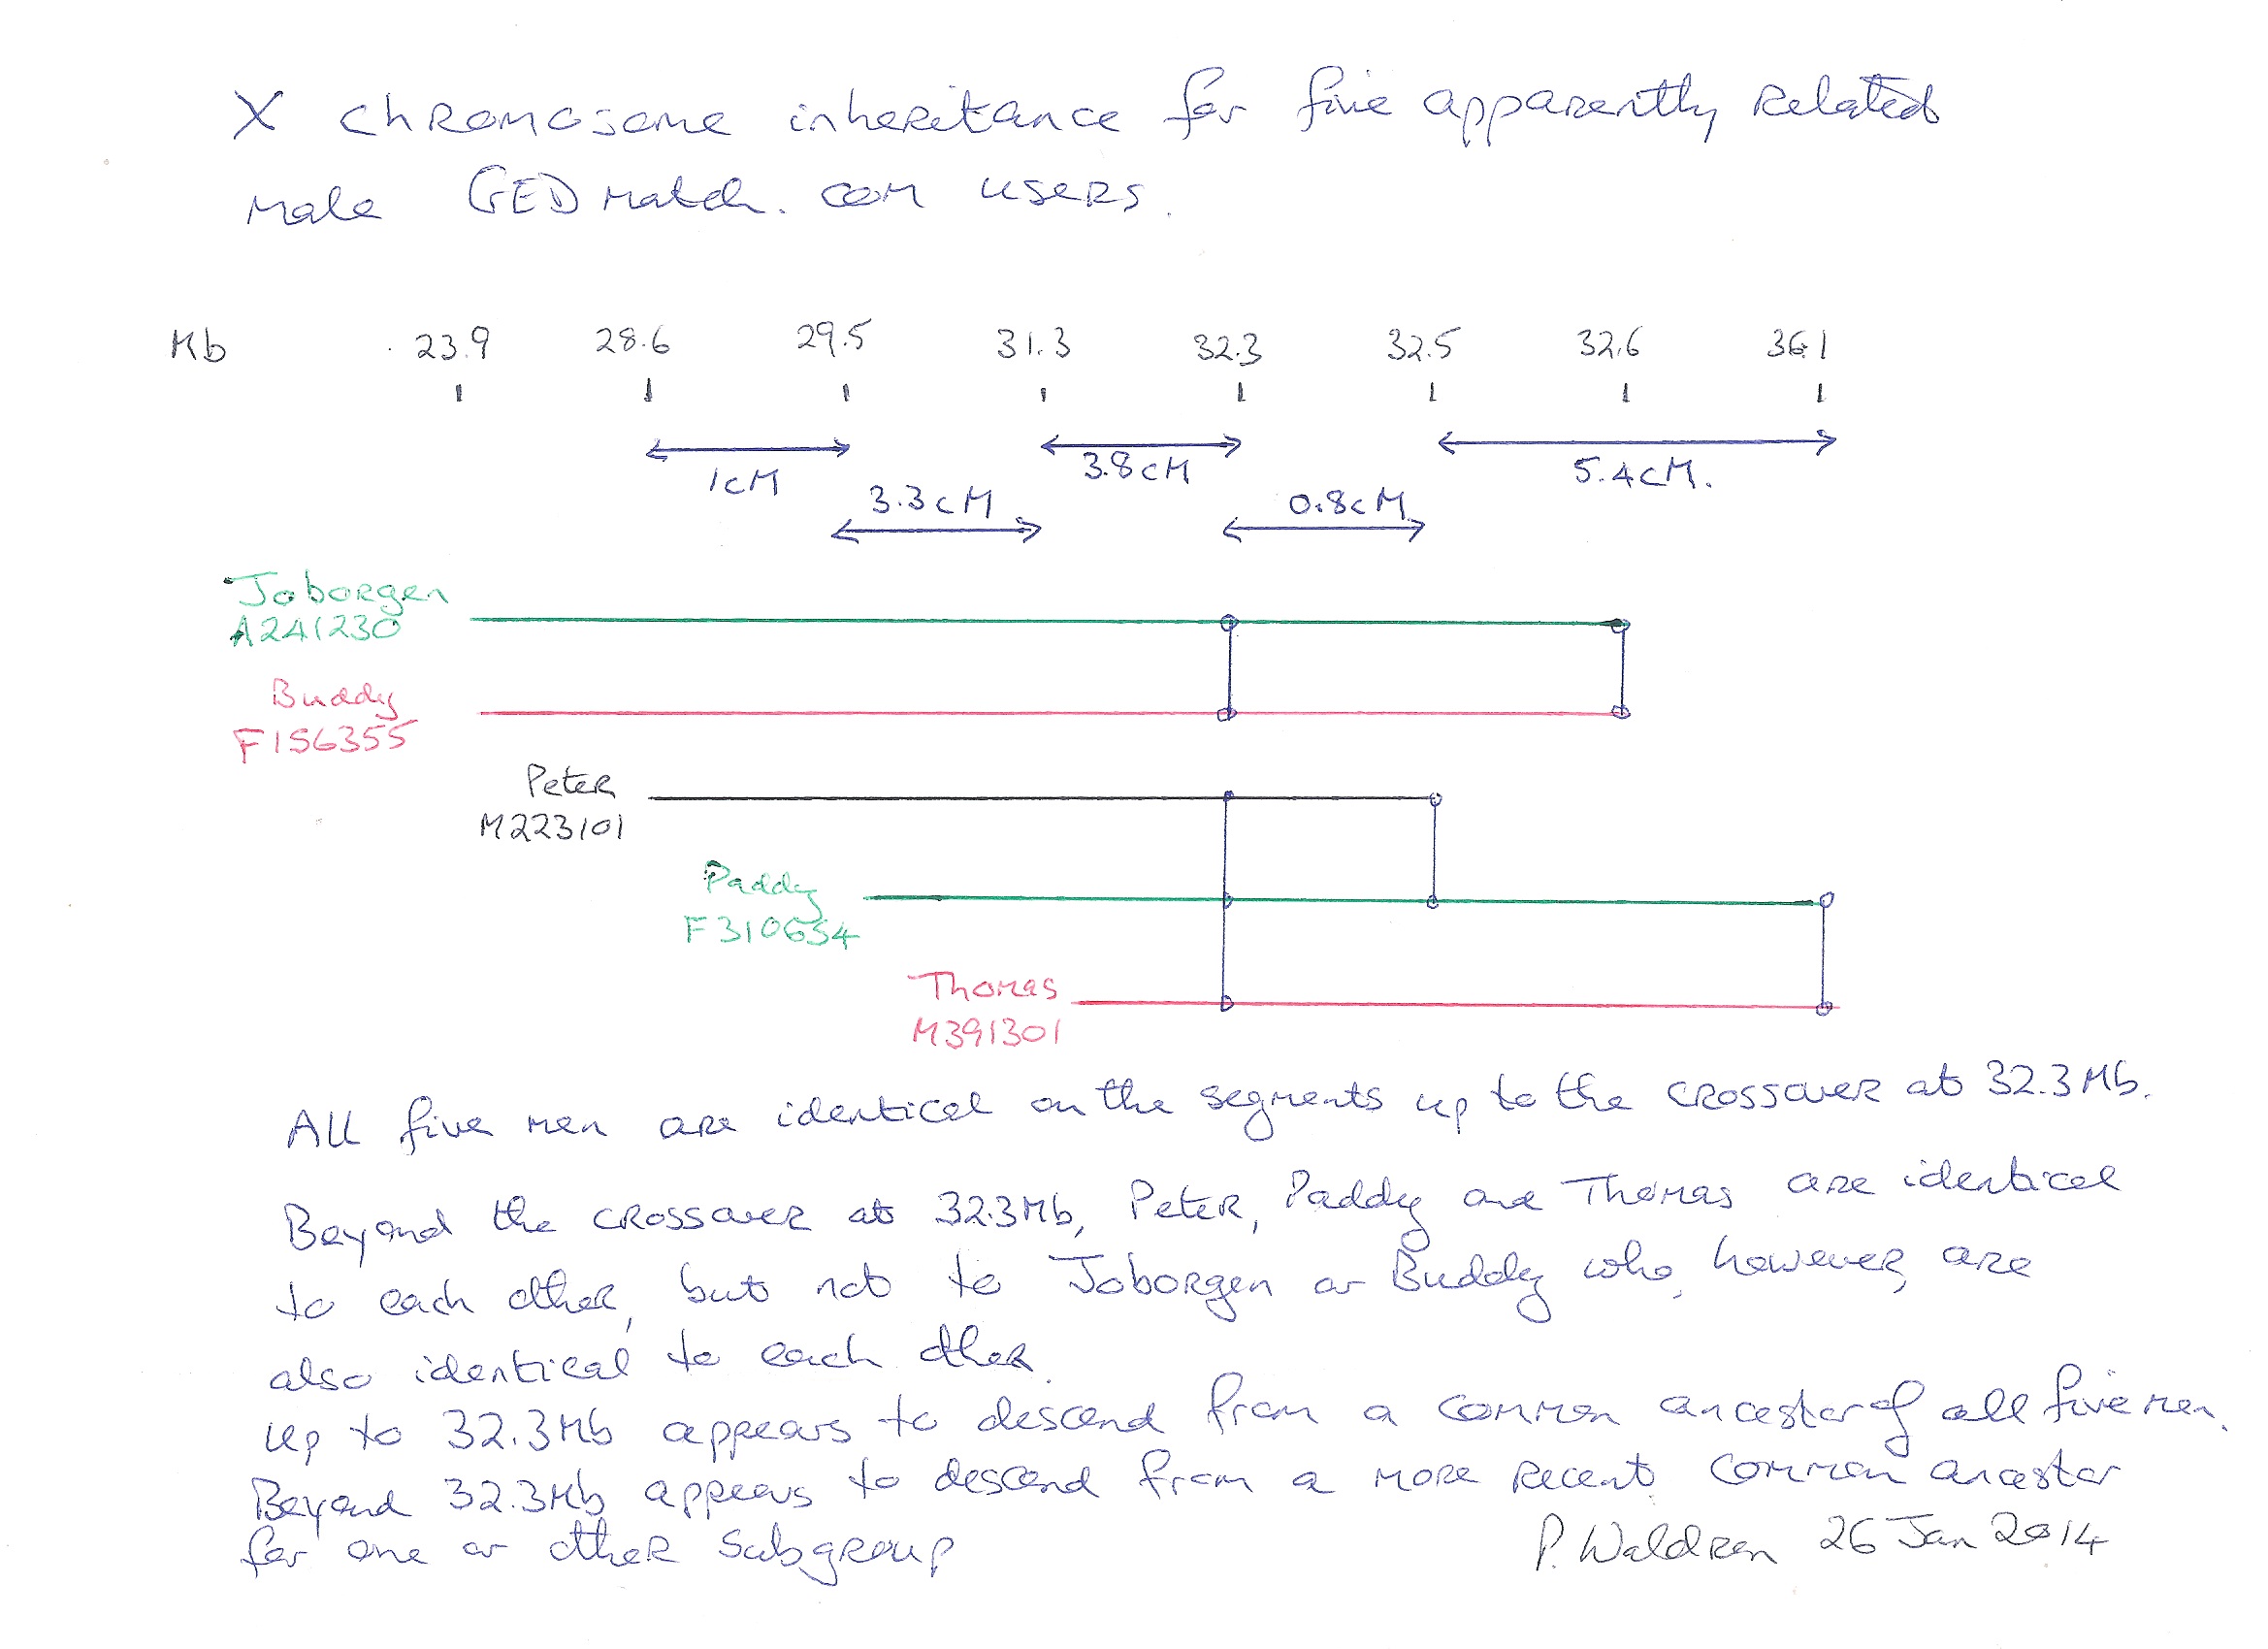
All five men are identical on the segments up to the crossover at
32,387,789, so these segments appear to descend from a common X
ancestor of all five men.
Beyond that crossover, the five men break into two subgroups:
A241230 and F156355 are identical to each other; and M223101,
F310654 and M391301 are all identical to one another. For one or
other subgroup, these segments appear to descend from a more
recent common X ancestor of the subgroup.
These small shared segments probably come from a very distant
common X ancestor, but, with at least five people known to be
identical on the same segment, the chances of finding a common X
ancestor for at least two of the five men are increased. If all of
them were willing to provide a means of contact and to discuss
their possible common X ancestors, the chances would be even
greater.
For further reading on X-DNA, see Louise
Coakley's
blog post.
Interpreting mtDNA results
Who shares mtDNA with you?
Did you ever wonder with whom you would share your surname if
surnames followed the female line instead of the male line? These
are precisely the people with whom you share your mitochondrial DNA.
In practice, however, if you look at the relationship diagram connecting you to a
distant mitochondrial cousin, everyone included will (typically)
have a different surname, apart from the most recent common male
ancestor and his two daughters.
Just as some surnames proliferate, due to many men of the surname
having several sons, and other surnames get "daughtered out", due
to men of the surname not marrying or fathering only daughters, so
some mitochondrial DNA signatures are more prolific than others.
For example, as of 31 January 2016, I had managed to document only
101 people (living and deceased) sharing my own mitochondrial DNA,
but no less than 449 sharing my father's mitochondrial DNA.
Indeed, my grandmothers' mitochondrial DNA is doomed, as each of
them had only one daughter, and each of those daughters in turn
had only sons. Once we are gone, our respective grandmothers will
never again have mitochondrial descendants.
My greatgrandmothers' mitochondrial DNA is in safer hands.
Greatgrandmother Waldron née Nolan has a female mitochondrial
descendant born in 2005; greatgrandmother McNamara née Clancy has
a female mitochondrial descendant born in 2013; greatgrandmother
Durkan née Durkan has several female mitochondrial descendants
born since the 1980s; and my other greatgrandmother Durkan née
O'Neil also has a female mitochondrial descendant born in the new
millennium.
In genetic genealogy, mitochondrial DNA is useful for situations
like these:
- In your ancestral research, you may come across two women with
the same maiden surname, who were of the same generation, and
lived in the same area, and you may want to know whether they
were full-sisters, the alternatives being that they were
half-sisters with the same father, or cousins of some sort. If
you can find a matrilineal (i.e. mitochondrial) descendant of
each woman and find that their mtDNA doesn't match, then you
have proven that the original women were not full-sisters; if
the mtDNA of the descendants does match, then it is very likely
that the original women were full-sisters and that the mtDNA
came from their mother. It may still be coincidence, as the two
mothers could be different women from the same matrilineal line.
In my own case, I am looking for a matrilineal descendant of
Bridget O'Dea who married John Ryan in Patrickswell parish on 21
February 1821, and hoping that her mtDNA will match that of
Maria O'Dea who married some years earlier and lived in the same
parish, further confirming the evidence that suggests that the
two O'Deas may have been sisters.
- You may have a marriage record for, say, Margaret Keas, and
several birth or baptism records for girls named Margaret Keas
from the same area around 20 or 30 years earlier, but you may be
unsure which birth or baptism record matches the marriage
record, which may not include the names of the parents of bride
and groom. If you can find a matrilineal descendant of the
Margaret in the marriage record, and matrilineal descendants of
the mothers of the Margarets in the birth or baptismal records,
and if there is just one mtDNA match, then you have ruled out
all bar one of the birth or baptismal records as a match for the
marriage record.
Finding candidates for a mitochondrial project is not as
straightforward as finding candidates for a Y-DNA project, as you
cannot just pick up the local telephone directory and turn to the
page for the relevant surname.
My mtDNA experience
When I submitted my own DNA sample, I was advised to defer
purchase of mtDNA analysis for various reasons, which may have
included:
- It is currently overpriced.
- Its price is expected to fall soon.
- The very slow mutation rates of mtDNA make it difficult to
identify precise relationships.
- One type of DNA result at a time is hard enough to get to
grips with.
- Examples such as those given above are rare, and those where
mitochondrial descendants of all relevant parties can be traced
are even rarer.
I eventually purchased the mtFull Sequence (FMS) product for
myself and received my results on 24 February 2015. My first and
only FMS match at a genetic distance of 0 at that stage was an
adoptee. Three more perfect matches appeared subsequently, one
each in 2015, 2016 and 2017, but we have been unable to find a
common ancestor between any two of us.
My most distant known mitochondrial ancestor is my GGgrandmother
Mrs. Mary O'Neil, who died in Barnalyra in County Mayo on 6 June
1887.
I also ordered mtFull Sequence for my paternal first cousin (who
shares my father's mtDNA) on 10 February 2016, because there was a
good chance that it could prove or disprove my hunch that two
early nineteenth century West Clare matriarchs are closely
related, namely:
- his most distant known mitochondrial ancestor Mary
Conors/Connors/oConnor of Glascloon in Killard civil parish
(wife of firstly Timothy Galvin and secondly Thomas Kelly, and
also one of my GGGgrandmothers); and
- Catherine Crotty of Breaghva in Moyarta civil parish (wife of
a McNamara, probably the Patt McNamara listed in Moyarta East in
the Tithe Applotment Book of 17 Nov 1827, when Breaghva appears
to be subsumed into Moyarta East).
These two women have much in common.
- Both are listed, apparently widowed, as occupiers in
Griffith's Valuation of Kilrush Poor Law Union, dated 20 August
1855; each occupied a house and offices with rateable annual
valuation of 15 shillings; Catherine McNamara was the only
female occupier listed in Breaghva and Mary Kelly was one of
only two female occupiers listed in Glascloon.
- Catherine's known children have implied birth dates between
1830 and 1835; Mary had a daughter married in 1846 and a
youngest child born in 1838; so their child-bearing years
overlapped, and both appear to have been born within a decade of
1800 and they appear much more likely to have been of the same
generation, rather than anything like aunt and niece.
- Family tradition is that Catherine's maiden surname was
Crotty, but no primary evidence to verify this has yet been
located; two greatnephews of a son-in-law of Mrs. Mary Kelly
told me in the 1980s that Mary's maiden surname was also Crotty,
but her first husband's tombstone and her last child's baptismal
record confirm that this is incorrect. Possible causes of the
incorrect oral tradition are that Mary came from a house that
subsequently became a Crotty house, or perhaps she exchanged
visits with a Crotty relative.
- Two of Mary's granddaughters by her first marriage in turn
married the same John McNamara and lived in the townland of
Moveen West, adjoining Breaghva. The McNamara families in
Breaghva and Moveen West claim not to be related in the male
line, but could they be related in a female line?
- Oral tradition is that both Catherine and Mary were from "The
West", a sort of moveable feast in County Clare, referring to
anywhere between the speaker's current location and Loop Head.
- One of the Mrs. John McNamaras is described in a letter from
about 1911 as a "cousin" of Mrs. Anne Eustace N.T., née Crotty,
from Ross in Kilballyowen civil parish.
- Both Catherine and Mary were prolific, in their own ways,
in terms of the number of descendants inheriting their
mitochondrial DNA, as shown in the following table, showing the
number of mitochondrial descendants of each of them (and of my
own most distant known mitochondrial ancestor) whom I had
documented as of February 2016:
| Generation 1 (Ancestor) |
Catherine Crotty |
Mary Conors |
Mrs. Mary O'Neil |
| Generation 2 (Children) |
3 |
5 |
6 |
| Generation 3 (Grandchildren) |
5 |
44 |
25 |
| Generation 4 (Greatgrandchildren) |
7 |
91 |
33 |
| Generation 5 (GGgrandchildren) |
8 |
99 |
19 |
| Generation 6 (GGGgrandchildren) |
9 |
100 |
11 |
| Generation 7 (GGGGgrandchildren) |
7 |
83 |
7 |
| Generation 8 (GGGGGgrandchildren) |
0 |
27 |
0 |
| My facebook friends |
2 |
21 |
2 |
If Catherine and Mary were first cousins, with different maiden
surnames, then there is one chance in three that their mothers
were sisters, and that they shared mitochondrial DNA.
Catherine has two GGgrandchildren (descended from different
children) with Family Finder results at FamilyTreeDNA.com (AF and
FM); Mary has two GGGgrandchildren from her first marriage (myself
PW and my first cousin AD) and one suspected GGgrandchild from her
second marriage (TE) with Family Finder results at
FamilyTreeDNA.com. (Family Finder results for children and
grandchildren of some of these five people are also available, but
can not add any additional information.)
The 3x2=6 possible Family Finder comparisons between Catherine's
descendants and Mary'sknown and suspected descendants reveal that
three of these six pairs are deemed to be FTDNA-overall matches,
as shown in this table (courtesy of the Clare Roots project at
FTDNA):
| |
| |
79.9988300000 |
35.9827300000 |
38.2373100000 |
0.0000000000 |
| 79.9988300000 |
|
59.8881800000 |
0.0000000000 |
0.0000000000 |
| 35.9827300000 |
59.8881800000 |
|
0.0000000000 |
0.0000000000 |
| 38.2373100000 |
0.0000000000 |
0.0000000000 |
|
903.0628100000 |
| 0.0000000000 |
0.0000000000 |
0.0000000000 |
903.0628100000 |
|
If Catherine and Mary were first cousins, then two of the bolded
comparisons (repeated on each side of the diagonal in this
symmetric table) would involve comparing fifth cousins and the
other four would involve comparing fifth cousins once removed. The
observed 50% match rate is far more than the predicted 10% or less
match rate given by FamilyTreeDNA for such distant relationships.
If the match rate for pairs of fifth cousins was 10%, then the
probability of three or more matches in six independent fifth
cousin comparions would be less than 0.13%. Although the
comparisons in this case are not independent, my theory that
Catherine and Mary were closely related is clearly a little more
than a hunch. The fact that there is only one match out of three
between Mary's descendants raises a red flag and suggests that
there may be a common ancestor somewhere else on the family tree.
There are two more of Mary's descendants at AncestryDNA and
GEDmatch.com, but one-to-one comparisons there don't strengthen
the case for a relationship between the two dynasties. Further
evidence unearthed after I generated the above table confirmed
that TE's GGgrandfather Thomas Kelly of Glascloon was not Mary
Conors' second husband of that name and townland, but an older
namesake, possibly his father.
It would be nice to see if the five individuals in this table
have any other matches in common, which is a report that is
theoretically available to project administrators, but this operation usually times out. It finally
completed on 11 March 2016 and reported "No In Common With
Members".
Catherine's mitochondrial DNA has long been known, through one of
her GGgrandchildren, to be from Haplogroup - H3-T16311C!. As of 4
May 2018, this GGgranddaughter's only Full Mitochondrial Sequence
match with a genetic distance of zero is one of her own daughters.
(Her mitochondrial DNA is unlikely to die out any time soon as all
of her four children, five of her six grandchildren and her first
greatgrandchild are females who have inherited her mtDNA.) As
Mary's mitochondrial DNA was available, through one of her
GGGgrandchildren, on whom only the Family Finder analysis had been
ordered so far, I decided that it was worth paying for
mitochondrial analysis on Mary's descendant for the one-in-three
or smaller chance that the possible relationship between Catherine
and Mary is on the mitochondrial line. Results were promised for
some time between 23 March 2016 and 6 April 2016, but I got an
e-mail on 11 March 2016 to say that they were already available,
and they showed a match date of 2 March 2016.
These
results suggested that Mary Conors' numerous mitochondrial
descendants belong to mitochondrial haplogroup H27. On 13
February 2018, I was alerted by another FTDNA customer to one
of her mtDNA matches who appears to be my second cousin and
also a mitochondrial descendant of Mary Conors. But his
mitochondrial haplogroup is H27-T16093C. It
appears that one mutation since my greatgrandmother has thwarted
the FTDNA matching algorithm, which believes that the two second
cousins are unrelated. The matching algorithm has worse
shortcomings, for it concluded due to similar recent mutations
that Blaine Bettinger and his mother were
unrelated, although autosomal DNA comparison had confirmed the
relationship.
As of 4
May 2018, FTDNA had no perfect (genetic distance of 0)
mitochondrial match to my first cousin, but two such matches
to my second cousin. By way of comparison, I belong to
mitochondrial haplogroup U4b1b2 and FTDNA then had four such
mitochondrial matches to me, and I was disappointed at how few
matches I had!
FTDNA
recalculated its mitochondrial matches in May 2016. Mine
remained unchanged. My first cousin acquired three new
matches, all backdated to 2 March 2016, two at genetic
distance 1 and one at genetic distance 3.
So it's
back to the drawing board on the theory that Catherine and
Mary were sisters' children. Even if we got a
perfect mitochondrial match, we still could not have ruled out the
possibility that the relationship between Catherine and Mary was
more distant - possibly much more distant - than first cousins.
A sample of six Family Finder comparisons is very small, and we
also need more descendants of both women to order Family Finder to
provide additional independent evidence, especially at least one
descendant each of Mary's daughters Biddy, Kitty and Peggie
Galvin.
Tools for analysing mtDNA (or the lack thereof)
There are unexpected and unexplained differences between the
tools for analysing mitochondrial DNA matches and those for
analysing Y-DNA matches.
For each of my Y-DNA matches at FamilyTreeDNA.com, I can click on
a TiP icon and get a Y-DNA TiP Report allowing me to see the
likelihood of the most recent common ancestor that I share with
the relevant match being a particular number of generations in the
past.
For mtDNA matches, there is no equivalent of the TiP icon.
Question 1: How can I work out the corresponding likelihoods in
the mitochondrial case?
My 71 Y-DNA37 matches come from many different Y-DNA Haplogroups
and are all a genetic distance of 2, 3 or 4 from me.
My 6 mtDNA matches as of 22 November 2015 all come from mtDNA
Haplogroup U4b1b, two at a genetic distance of 0 from me and four
at a genetic distance of 2 from me.
Anthea's 31 mtDNA matches as of 22 November 2015 all come
from mtDNA Haplogroup U5a2b4 and
are all a genetic distance of 1, 2 or 3 from her.
Without the ability to turn "genetic distance" into a probability
scale, I find it impossible to interpret these results.
Question 2: Why are the Y-DNA
interface and the mtDNA
interface at FamilyTreeDNA.com so different?
Myself, Anthea and a third person are each half-identical to the
other two on the same substantial part of Chromosome 6. Anthea and
the third person both belong to mtDNA haplogroups beginning with U5a2. It
would be nice to get some idea of the likelihood that the most
recent common ancestor from whom we inherited the autosomal match
was on the shared matrilineal line of Anthea and the third person.
As I have read that mitochondrial mutations are very rare, I
suspect that the likelihood in this case is small.
Question 3: How can I put some sort of number or probability on
this likelihood?
I started a discussion
around these three questions on facebook.com.
For further reading about mitochondrial DNA, these are probably
the places to look:
http://www.isogg.org/wiki/MtDNA_testing_comparison_chart
http://www.mitosearch.org/
http://www.mtdnacommunity.org/
Chapter 8:
There are a number of software tools available to aggregate
autosomal DNA matches from the various online autosomal DNA
comparison databases which provide segment data for matches (i.e.
for all except AncestryDNA), including DNApainter.com and Genome
Mate.
DNApainter
A free account at DNApainter.com
allows the creation of a profile for a single individual and manual
addition of matches; a paid account allows the creation of multiple
profiles and the direct import of bulk segment data downloaded from
the various DNA comparison websites.
I finally got around to subscribing and downloading and uploading
all my GEDmatch, FTDNA and MyHeritage matches on 18 January 2020.
After trial and error, I recommend these settings when importing
your file of match settings into DNApainter:
- Exclude segments under 8cM
- Exclude larger matches sharing over 600cM in total
- Exclude smaller matches sharing under 8cM in total
I initially set the threshold for individual segments too low at
7cM, revealing some potential inbreeding on my paternal side that I
was not previously aware of:
- on Chromosome 8, G.C. (related to my paternal grandmother)
shares a 7.0cM segment (6.3cM at GEDmatch) with M.F. (related to
my paternal grandfather);
- on Chromosome 9, G.C. (related to my greatgrandmother Mary
Anne Clancy) shares a 7.2cM segment (7.6cM at GEDmatch) with
R.Z. (related to my greatgrandfather Old Johnnie McNamara);
- on Chromosome 15, A.T. (related to my greatgrandfather Old
Johnnie McNamara) shares a 7.9cM segment (7.2cM at GEDmatch)
with P.M. (related to my greatgrandmother Mary Anne Clancy); and
- on Chromosome 22, B.M. (related to my GGgrandmother Mary
Galvin) shares a 7.1cM segment (4.1cM at GEDmatch) with D.P.-B.
(related to my GGgrandfather George Clancy). [I have a theory
that these two are 4C1R as they descend from two O'Brien
next-door neighbours who may have been sisters; but I shouldn't
share any O'Brien segments that they share.]
I excluded larger matches sharing over 600cM in total, as there is
no point in including my first cousins and double second cousins, as
the purpose of the exercise is to assign DNA segments to
grandparents and more distant ancestors, and it is impossible to
tell from which of the two relevant grandparents a segment shared
with a first cousin or double second cousin has come. You may
have to vary the 600cM threshold to ensure that you exclude as many
as possible of the matches related to both paternal grandparents or
related to both maternal grandparents, but still include all matches
related to only one of your grandparents.
I don't see any reason for excluding matches who are known relatives
but share only one segment with me, as long as that segment is over
8cM.
A profile including all of one's imported matches will look a bit of
a mess at first, but one can select PATERNAL or MATERNAL at the
bottom right, and then select the big + sign at the top left to
expand all chromosomes and show the segments assigned to known
relatives.
In this initial exercise, I painted 37% of my paternal chromosomes,
but only 19% of my maternal chromosomes.
I shared my chromosome map with my Facebook
friends but am reluctant to share it on this public web page in case
of objections on privacy grounds.
If you match me at AncestryDNA and would like to be added to this
pretty chromosome map, then you will have to copy
your results to GEDmatch, MyHeritage and/or FamilyTreeDNA (for
free). If you match me at GEDmatch but don't appear on the
chromosome map, then you probably haven't logged in to GEDmatch and
approved the change of ownership which took place in December 2019.
Genome Mate
Genome Mate can be installed and run within your web browser from
genomemate.org.
I have created separate Genome Mate profiles for myself, for my
paternal first cousin and for my maternal first cousin, by
importing match data and chromosome browser data downloaded from
FamilyTreeDNA.com for each of us, on 20 July 2014. I accepted the
default 7cM/500SNP cutoffs for now.
This enables me to work through my FTDNA-overall-matches and
identify those who must be paternal (because they match both me
and my paternal first cousin where we match each other) and those
who must be maternal (because they match both me and my maternal
first cousin where we match each other) .
I eventually worked out the following methodology:
- Select my own profile
- For each chromosome (1 to 22 and X):
- For each segment, for each relative
- Point-and-click the relative's name, then
point-and-click the View Relative button at the bottom
left of the pop-up window
- If the Relative Details pop-up window shows that (s)he
matches both myself and one of my first cousins on
overlapping segments, then
note the name and click on one of the segments to check
that my first cousin and myself match on that segment.
- If so, then
- Cancel
- Set ICW Group (in my own profile) to Maternal or
Paternal as appropriate
- point-and-click Update Segments button at bottom
middle of pop-up window
- select my profile
- check that All DNA Segments, Update ICW Group and
Update Confirmed Ancestors boxes are ticked
- Apply Changes
- switch to the relevant first cousin's profile on
the dropdown at top left
- point-and-click the relevant Relative name
- Set ICW group (in my cousin's profile) to Paternal
or Maternal as appropriate (as my cousin's are my
father's sister's child and mother's brother's
child, the selection will always be the reverse of
what I selected in my own profile)
- point-and-click Update Segments button at bottom
middle of pop-up window
- select my cousin's profile
- check that All DNA Segments, Update ICW Group and
Update Confirmed Ancestors boxes are ticked
- Apply Changes
- switch back to my own profile on the dropdown at
top left
- Else,
- If the relative matches myself and a first cousin
in non-overlapping locations, then
- note "Matches myself and [cousin] in different
locations." in the Relative Note box, Save, Save
- Else
- Proceed to next relative.
This will be a long and tedious process!
Introduction
Among the trickier parts of genetic genealogy is developing
appropriate strategies to adopt:
- after you order and after you receive new DNA results for a
known or probable relative;
- after you identify a new possible relative from a list of DNA
matches; and
- after a possible relative becomes a probable relative through
the discovery of a common ancestral surname and/or a common
ancestral location.
Given an individual of interest, these strategies can involve a
mixture of:
- searching various DNA databases for further possible relatives
to investigate or to contact, in particular:
- the 1500 one-to-many GEDmatch matches of the individual of
interest, if he or she has copied his raw data to
GEDmatch.com; and
- the ADSA output for the individual of interest, if he or
she is willing and able to generate it and e-mail it to you;
- searching traditional genealogical sources to verify possible
relationships, in particular:
- the GEDCOM file of the ancestors of the individual on
interest, wherever it might be available;
- identifying and recruiting further individuals whose DNA will
help your research;
- raising funds to pay for analysis of further DNA samples;
and/or
- learning a little more of the scientifc theory behind DNA
comparisons.
If not properly thought out and planned, the process can become
overwhelming, frustrating or confusing for a variety of reasons:
- this is cutting edge science, and both the commercial and
volunteer websites are struggling to keep up with demand, with
perceived competition, and with scientific developments;
- DNA inheritance is a game of chance, and you will back losers
as well as winners;
- most people have many thousands of relatives within the range
of autosomal DNA matching;
- traditional genealogical sources generally do not reach as far
back in time as autosomal DNA matching;
- your possible relatives are probably just as overwhelmed or
frustrated or confused as you are, and may also have much less
time for the subject or much less interest in it than you have;
- etc.
In this chapter, I will set out, in no particular order, as of
yet, some of my thoughts on strategies which may prove helpful.
Developing an autosomal research strategy using DNA from more
people
This section is inspired by my totally unexpected discovery that
my closest initial FTDNA-overall-match is not only an adoptee, but
a foundling.
Developing the optimal research strategy, particularly when there
has been an adoption or other non-paternity event, requires the
research to reconcile conflicting emotional, scientific and
economic motivations.
People on both sides of the adoption brick wall may experience
unexpected and unpredictable emotional reactions. Some
people on both sides of the adoption brick wall will accept that
they cannot change the past; others may wish to let bygones be
bygones and be unwilling to investigate the past. The biological
parent(s) of the adoptee may or may not be the first suspect(s) in
the family tree that come to mind as perhaps having had a child
out of wedlock.
The scientific approach will suggest taking DNA samples
from as many potential relatives as possible, rather than zeroing
in immediately on the most likely suspects suggested by the
historical evidence.
The economic problem is that DNA analysis is still
costly, particularly if there are dozens of members of a large
extended family available for sampling. Unless a fairy godmother
is willing to pay for the analysis of all the samples that
statistical rigour requires, a degree of negotiation between the
parties will possibly be required.
Some compromise is inevitable between these three motivations.
This may require the combined skills of a social worker, a
statistician and a businessman.
Before planning a scientific research strategy, one must decide
on the specific objective of the research. In other words, the
first step is to decide on the precise hypothesis that one wishes
to test. This hypothesis should be something along the lines of
"Jack and Jill were siblings" or "Tom was the father of Dick and
Harry".
The optimal research strategy will depend critically on both the
hypothesis to be tested and the budget, the time and the degree of
co-operation from the extended family which are available. Costs
will undoubtedly continue to fall, but if we wait for ever we'll
all be dead before we get anywhere.
The strategy to be decided at each step basically involves
answering the question: "Whose autosomal DNA should be analysed
next?" As the solution comes within sight, it may become
appropriate to look at other forms of DNA. For example, if you
find two female ancestors that you suspect were sisters, then you
might want to look at mitochondrial DNA from a matrilineal
descendant of each.
Thus one should probably follow all of the following strategies
in parallel as funds and time permit.
The hunch strategy
Let your genealogical instinct suggest the precise hypothesis to
be tested. If the evidence causes you to reject your hypothesis,
go back and come up with a new hypothesis.
In an adoption case, you may have a hunch as to which member or
members of the extended family is most likely to have produced a
secret love child. So cut to the chase and look for a DNA sample
from his or her closest known relative. Even if your suspect is
long dead or has lost contact with the family many years ago, a
certain amount of diplomacy will be required here. Adoption
counselling services are there to help. (As of 7 September 2014,
however, the Adoptions
Rights Alliance has no reference to DNA or genetics on its
home page.)
The rarity strategy
Is the DNA of a particular branch of your family in danger of
extinction or dilution?
If you have a relative who is of great age or seriously ill,
collect a sample of his or her DNA before it is too late.
Digging someone up to collect DNA after he or she is dead and
buried is awkward and expensive and unpleasant and messy and
requires exhumation orders and incurs legal costs.
The day is probably not far away when funeral directors will
routinely offer to collect and preserve a DNA sample from the body
of a deceased person.
Rarity value arises not only from calendar age or life
expectancy, but also from position in the family tree.
The DNA of an only surviving child is more irreplacable than the
DNA of a child from a large family.
The higher up the family tree an individual is, the more useful
his or her DNA will be. For example, the youngest child of the
youngest child of an ancestor may have been born long after the
oldest child of the oldest child of the oldest child of the
ancestor (his first cousin once removed). But he is one generation
higher up the tree, so his autosomal DNA is expected to contain
twice as much of the common ancestral couple's DNA as that of the
oldest person on the next generation down.
If you are just interested in identifying a common ancestor, then
the DNA of a child whose parents' DNA has already been collected
will be of no incremental value. On the other hand, if you are
interested in chromosome mapping and phasing, then sampling a
child and both parents is of critical importance. We have already
seen in Example A that looking at parents' DNA can help to quickly
identify smaller half-identical regions as merely half-identical
by chance.
In my case, the rarity strategy points me towards my mother's
maternal first cousins. Her last sibling died in 2006 and her last
paternal first cousin died in 1981, but three or four of her
maternal first cousins were still alive, aged 78 and upwards when
I got my own DNA results. My father's paternal first cousins and
maternal half first cousins are younger and/or more plentiful.
In any case, start with the earliest living generation - it may
cost twice as much, but you will learn more than twice as much by
sampling your father or paternal uncle or aunt and your mother or
maternal uncle or aunt as you will learn by sampling yourself.
If you find a suspected relative, for example an adoptee, and
have no idea which side of the family he or she comes from, the
most logical approach is to repeatedly bisect your pedigree chart.
If neither person is an adoptee, then both can pursue this
strategy simultaneously. And it will leave a framework in place
for identifying your common ancestor with future mystery matches.
Find a living paternal relative (who is not also a maternal
relative), by working through father, paternal grandparent or
greatgrandparent, paternal uncle or aunt, paternal first cousin,
and so on, until you find someone living and willing to provide a
DNA sample. (Your own siblings, nieces, nephews, etc., will not
give any independent evidence about the relationship of interest
beyond what your own DNA sample has revealed.)
Then find a living maternal relative, by working through mother,
maternal grandparent or greatgrandparent, maternal uncle or aunt,
maternal first cousin, and so on, until you find someone living
and willing to provide a DNA sample.
If the original match matches the paternal relative but not the
maternal relative, then you can be fairly sure that he or she is
related on the paternal side, and vice versa.
Now move back a generation and repeat the process:
Suppose the original match turns out to come from your maternal
side.
Find and sample a living relative on your maternal grandfather's
side (maternal grandfather, greatuncle or greataunt on that side,
first cousin once removed on that side, second cousin on that
side, etc.).
Also find and sample a living relative on your maternal
grandmother's side (maternal grandmother, greatuncle or greataunt
on that side, first cousin once removed on that side, second
cousin on that side, etc.).
If the original match matches the maternal grandfather's relative
but not the maternal grandmother's relative, then you can be
fairly sure that he or she is related on the maternal
grandfather's side, and vice versa.
Continue until you come to a step where the original match
matches both sides. Now you've almost certainly found your common
ancestral couple.
If cost is not an obstacle, then you can immediately start
collecting DNA samples from all those who you might in future want
to approach in connection with a particular study, for example:
- two first cousins, one paternal and one maternal
- four second cousins, one descended from each pair of
greatgrandparents
- eight third cousins, one descended from each pair of
greatgreatgrandparents
- sixteen fourth cousins, one descended from each pair of
greatgreatgreatgrandparents
- and so on.
If you have living relatives from a generation before your own on
any side, then substitute one of them for the person from the
subsequent generation.
As noted above, beyond third cousins
there is a significant probability that one or other or both
parties will not have inherited any autosomal DNA from the common
ancestral couple, so the value of this approach declines.
If the objective is purely to work out to which branch of your
ancestry distant DNA matches belong, then you might skip the first
and second cousins and just recruit third cousins.
Note that I have not mentioned siblings in this section; the
usefulness of their DNA is in increasing the precision of
estimated relationships, a topic to which I will now turn.
The precision strategy
Nobody would carry out an opinion poll based on a sample size of
one, but that is precisely what the matching algorithms of the DNA
companies do.
Another field of applied statistics in which I have extensive
experience is the handicapping of racehorses - allotting the
weights to be carried by each horse in a race on the basis of
observed ability in order to equalise their chances of winning.
Handicappers are not required to assess a horse's ability until it
has raced three times, typically in races where the number of
runners is in double figures. The matching algorithms of the DNA
companies are comparable to requiring handicappers to make a
definitive judgement of a horse's ability after a single run in a
two-horse race.
As in both of these examples, proper statistical analysis
generally requires taking a large sample of independent and
identically distributed observations and looking at the average of
those observations.
The bigger the sample, the smaller the margin of error.
If you have not already done so, ask living relatives from
generations older than your own to provide DNA samples. It will be
a great help in distinguishing from which side your matches come
and how closely they are related to you.
Anyone from an earlier generation is expected to share twice as
much autosomal DNA with mutual relatives as you do; those from two
generations earlier are expected to share four times as much; and
so on. So it is important to obtain samples from parents, aunts
and uncles and cousins once removed (and, even more so, from
grandparents, greataunts, great uncles and cousins twice removed)
before it is too late. These samples will both provide more
accurate estimates of relationships and more segments of your
common ancestral couple's DNA which may match those inherited by
other descendants.
As the observed ranges of shared DNA for close relatives do not
overlap, it is immediately possible to identify and distinguish
between parent/child (100%), full-sibling (75%), half-sibling
(50%), uncle-or-aunt/nephew-or-niece (25%) and first cousin
(12.5%) relationships. Beyond this, the shared percentages are
closer together and the standard deviations relatively larger, so
it becomes impossible to distinguish between relationships using
samples of one. The solution is to obtain DNA samples from known
relatives of either or both parties.
This is easy to do if you and/or your suspected relative have
siblings and/or half-siblings on the side you are interested in.
Combining information from siblings' DNA to estimate
relationships more precisely
A simple way to arrive at more precise relationship estimates is
to just collect DNA samples from all the siblings on each side of
the brick wall and look at the average of the pairwise Shared cM
between the two families. The original single observation may not
have been able to distinguish between, say, second cousin (and
equivalents), second cousin once removed (and equivalents) and
third cousin (and equivalents). The average pairwise Shared cM
between the two families will have a much smaller associated
standard error, so will potentially give an unambiguous inference.
Remember, however, that two first cousins, for example, are
expected to share the same percentage of their DNA as a greatuncle
and his greatnephew, so traditional genealogical evidence, such as
birth dates, will still be required to distinguish between such
equivalent relationships.
If you collect DNA from several family groups of first cousins,
your observations are no longer independent, so a simple weighted
averaging process is necessary.
In the case of the two sibling groups, the averaging procedure is
essentially equivalent to estimating the Shared cM between one of
the parents of one sibling group and one of the parents of the
other sibling group.
If you have samples from several family groups descended from a
common ancestor, then you can work back through the generations to
estimate the Shared cM between the common ancestor and the person
you are trying to fit into the family tree.
For example, suppose Joan and Peter are siblings and have Shared
cM of 75.1 and 60.4 respectively with Anthea, whom we have reason
to believe is related to them on their now deceased father
Richard's side. Joan and Peter each got half of their overall DNA
from Richard, so we expect that on average they got half of the
DNA that Richard shared with Anthea. From Joan's figure, we can
estimate that the Shared cM between Richard and Anthea was 2 x
75.1 = 150.2, and from Peter's figure we can estimate that the
Shared cM between Richard and Anthea was 2 x 60.4 = 120.8. The
obvious way to combine these estimates is to take the average, so
our first crude point estimate of the Shared cM between Richard
and Anthea is (150.2 + 120.8)/2 = 135.5.
Now suppose we also have a sample from Richard's first cousin
Patricia, whose Shared cM with Anthea is 78.1. Using the same
logic as before, Richard's mother Lillian is expected to have 2 x
135.5 = 271.0 Shared cM with Anthea and Patricia's father Thomas
is expected to have 2 x 78.1 = 156.2 Shared cM with Anthea.
Lillian and Thomas are siblings, so the average of their Shared cM
with Anthea will be a more precise estimate than either of these
figures on its own: (271.0 + 156.2)/2 = 213.6.
As the standard errors for the original one-to-one comparisons
are not reported, it is difficult to work out the standard errors
for the averaged comparisons, but they must be smaller.
These examples look only at the aggregate length of the regions
on which two siblings are half-identical to a third person. A more
sophisticated estimation technique can be used if the locations of
the half-identical regions are also known. Ex ante, we
would expect both siblings to be half-identical to the third
person on 1/3 of the aggregate length; just one sibling to be
identical on 2/3 of the aggregate length; and their relevant
parent to be half-identical to the third person on a further 1/3
of the aggregate length on which neither child is half-identical
to the third person. When we add the aggregate lengths together,
double counting the 1/3 on which both siblings are half-identical
exactly compensates for not counting the 1/3 on which neither
sibling is half-identical. If both siblings are half-identical to
the third person on exactly the same region(s), then we should
begin to doubt that there was any other region(s) on which the
parent was half-identical to the third person; adding the
siblings' Shared cM in this case probably overestimates the
parent's shared cM. Conversely, if there is no overlap between the
regions where the two siblings are half-identical to the third
person, then we should begin to suspect that there are other
segments shared by the parent and the third person which neither
child inherited; adding the siblings' Shared cM in this case
probably underestimates the parent's shared cM. A better estimate
of the Shared cM between the parent and the third person would be
based on two separate estimates of the aggregate length of the
regions where the parent but neither child matched the third
person.
A little algebraic notation will make the calculations easier to
follow. Let x denote the aggregate length of the regions
where both siblings match the third person, and let y
denote the aggregate length of the regions where exactly one
sibling matches the third person. If we just knew x, then
we would expect the aggregate length of the regions where the
parent but neither child matched the third person to also equal x.
Similarly, if we just knew y, then we would expect the
aggregate length of the regions where the parent but neither child
matched the third person to equal 0.5y. A better estimate
of the uninherited length can be obtained averaging these
estimates: 0.5x+0.25y. Thus the best estimate of the
Shared cM between the parent and the third party is x+y+0.5x+0.25y=1.5x+1.25y.
For example, if both siblings match the third party on the same
100cM regions, then x=100 and y=0, so our best
estimate is that the parent matched the third party on 150cM.
However, if both siblings matched the third party on
non-overlapping 100cM regions, then x=0 and y=200, so our best
estimate is that the parent matched the third party on 250cM. As
intuition suggested, the first of these estimates is less than the
initial crude estimate of 200cM, but the second is greater.
Note that if two known relatives match a third party, the match
is more significant (indicative of a closer relationship) if the
half-identical regions are non-overlapping. Conversely, if two
unconfirmed relatives match a third party, the match is more
significant (indicative of an ancestor common to all three people)
if the half-identical regions are overlapping; otherwise, the two
relationships might be on opposite sides, or the half-identical
regions might be only half-identical by chance.
A similar formula is easily derived for the case where n
siblings are being compared to a single possible relative. Let l(i)
denote the aggregate length of the regions on which exactly i
of the n siblings are half-identical to the possible
relative. Let f(i,n)=nCi*2-n
denote the probability of i successes in n
binomial trials where the probability of a success in each trial
is 50%. We have n separate estimates of the unobservable l(0),
namely l(i)*f(0,n)/f(i,n)=l(i)/nCi
for i=1,2,...n. The best estimate of the unobservable l(0)
is the simple average of these n separate estimates.
The estimation becomes a little more intricate when DNA from
multiple siblings on each side of the brick wall is available for
analysis. It becomes more intricate again if we move back another
generation and want to estimate the shared cM between the deceased
grandparent of two living cousin groups and a possible relative.
The segments shared by the grandparent and the possible relative
can be broken down into the following categories:
- segments shared with the possible relative by one or more
children in both families
- segments shared with the possible relative by one or more
children in exactly one of the families
- segments shared with the possible relative by the parents of
both families but not by any of the grandchildren
- segments shared with the possible relative by exactly one of
the parents of the families but not by any of the grandchildren
- segments shared with the possible relative by the grandparent
but not by either of his or her children
The first two categories can be measured. The last three have to
be estimated using a similar methodology to that already used when
going back just one generation. [A little more thought will be
required to come up with a sensible methodology here.]
If you and/or your suspected relative have no siblings or members
of an earlier generation available for sampling, or have already
sampled all available siblings and want to move out to first
cousins, then start with one cousin from each family. If an uncle
by chance inherited less autosomal DNA than expected from the
relevant side of the family, then his children can all be expected
to have also inherited less autosomal DNA than otherwise expected
from that side of the family. In other words, the information
supplied by the DNA from two of his children is not independent in
the same way as that supplied by two first cousins would be.
For this reason, if you are sure that your suspected relative is
from your maternal side rather than from your paternal side, then
you will actually learn more by sampling your maternal first
cousins (one from each family) than by sampling your own siblings.
If funds extend to sampling multiple first cousins from different
family groups, similar principles apply. Suppose Beatrice, Thomas
(Jr.), Martin, Catherine and Anne, all now deceased, were
siblings, children of Thomas (Sr.) and Mary, but you have DNA
samples from three of Beatrice's children, five of Thomas's
children, one of Martin's children, one of Catherine's children,
and two of Anne's children. Let's suppose we want to investigate
how Thomas (Sr.) or Mary was related to Anthea. First we estimate
Beatrice's relationship to Anthea by averaging the Shared cM for
Beatrice's three children, then doubling the result (since each
child is expected to have inherited half of Beatrice's Shared cM).
Similarly, average the Shared cM for Thomas (Jr.)'s and Anne's
children and double the results, and double the Shared cM for
Martin's child and Catherine's child. Now we have five independent
estimates of the expected Shared cM between Anthea and the
children of Thomas (Sr.) and Mary. Again just average these five
estimates and double the result to estimate the Shared cM between
Anthea and whichever of Thomas (Sr.) and Mary is related to her.
If this Shared cM figure is not high enough to prove that Anthea
is a direct descendant of Thomas (Sr.) and Mary, then further
evidence (following the bisection strategy above)
will be required to determine whether the relationship is on
Thomas (Sr.) 's side or Mary's side.
In the same way as we can now combine Shared cM data for many
descendants of a long-dead ancestor to estimate that long-dead
ancestor's relationship to a living person, we could potentially
combine the observed genome or SNPs of many descendants of the
long-dead ancestor to estimate the genome of that ancestor. Blaine Bettinger
takes this idea much further in his blog post Genetic
Genealogy
in 2050 (or Maybe 2015?).
The other-types-of-DNA strategy
If there is a choice between equally related individuals, always
choose someone who might share X-DNA with someone whose DNA has
already been sampled over someone who cannot. Within those who
might share X-DNA, choose a male, who has only one X chromosome.
For example, I have two paternal first cousins, my uncle's
daughter and my aunt's son. The uncle and aunt are both long
deceased, so not available for sampling. My uncle's daughter has
two X chromosomes: one on her mother's side which is of no
interest to me; the other on her father's side, which comes from
my paternal grandmother's parents (McNamara and Clancy). My aunt's
son has one X chromosome, which comes from my paternal (his
maternal) grandparents (Waldron and McNamara). If I was interested
in investigating a relationship on the Clancy side, then I should
get a sample from my uncle's daughter. If I was interested in
investigating a relationship on the Waldron side, then I should
get a sample from my aunt's son. Otherwise, my aunt's son's DNA
will be more useful, as his mitochondrial DNA traces back to the
mother of the four Galvin sisters and their Kelly half-sister, who
founded an enormous dynasty of direct female line descendants.
On the other side, I have nine living maternal first cousins, all
uncle's children, five male and four female. The males get their
X-DNA from their mothers, who are not related to me. The females
are my X cousins, so their samples are of more interest to me. One
of them is an only child, so is the obvious candidate to sample
first.
Ultimately, using X-DNA allows one to see whether the possible
ancestor might be narrowed down to the sets of people from whom
each individual inherits X-DNA. If the two autosomal matches are
X-DNA matches and either of them is male, then a relationship on
the paternal side (and on any line involving two males in
consecutive generations) can immediately be ruled out.
Using X-DNA to further one's analysis involves no extra cost;
using Y-DNA or mtDNA will require an extra payment. Once that
extra payment has been made, it is relatively straightforward to
use Y-DNA or mitochondrial DNA to investigate whether the
relationship being investigated might be on the direct male line
or on the direct female line.
What to do before and after results for your paternal and
maternal relatives arrive
I eventually decided to follow the bisection strategy outlined
above.
On 23 February 2014, I convinced two first cousins, my father's
sister's son Antoin and my mother's brother's daughter Mary, to
allow me to order Family Finder for them. As they live outside
the USA, there was really no choice about which DNA company
to use: ancestry.com still refused at that time to take orders
from anywhere outside the USA and 23AndMe imposes exorbitant
shipping charges which are far better spent on having an extra
person's DNA analysed by FamilyTreeDNA.
If you already have a FamilyTreeDNA account and want to order a
kit for another person:
- go to https://www.familytreedna.com/
- enter your Kit No. or Username and Password and LOG IN
- go back to https://www.familytreedna.com/
- select the
 link to go to https://www.familytreedna.com/family-finder-compare.aspx
- select the Add to cart link which will generate a pop-up menu
comprising your existing kit number and "Kit #2"; select the
latter
- You will have at least one coupon for uploading your GEDCOM,
so select the "Do you have a coupon?" link at the bottom right
and copy and paste Your Coupon Code from the e-mail generated
when you uploaded your GEDCOM.
- select Apply.
- If you have uploaded your GEDCOM more than once, either
because you have learned new information, or because you were
unable to discover which character set FTDNA expects your GEDCOM
to use, then you will have multiple coupons, but it appears to
be possible to use only one coupon per order.
- In the top middle, "Select this tester's gender" by ticking
the relevant radio button.
- Proceed to checkout.
- Your billing address will already be filled in; select Edit at
the bottom right to fill in the shipping address for your
relative (and Save), and complete the Payment Method section at
the bottom left (and Accept Terms & Complete Purchase).
- This gives you a new kit number; log out and log in again to
the new kit to prepare your relative's profile.
Neither of my first cousins was interested enough to want their
own e-mail address or telephone number used! So I immediately
received their kit numbers and passwords. What next?
While waiting for DNA results to
arrive from FamilyTreeDNA, the following steps need to be taken.
You will want to make an immediate impression on your DNA matches,
so it is too late to do this after the results arrive. You can
keep an eye on your Order History page to see when you should
expect to receive your results. Sometimes the results begin to
appear on the website a day or two before e-mail notification
arrives.
- Once you have a kit number and password, fill in the FTDNA personal
profile for the DNA subject. If there is no password
in the first e-mail that you receive from FamilyTreeDNA, then
you can reset the password from the Forgot Your Password? page.
- The most important things to complete is the Genealogy section. Remember that the
request for Most Distant Ancestors (Direct Paternal and
Direct Maternal) is a request for the earliest known
patrilineal ancestor (the father's father's father's line,
from which the subject's Y-DNA has come, or would have come
if she was not female) and the earliest known matrilineal
ancestor (the mother's mother's mother's line, from which
the DNA subject's mitochondrial DNA has come), and that you
have to squeeze names, dates, places and comments into for
each into a 50-character string.
- There is no need to complete the Surnames section
manually, as this will be populated automatically when you
upload a GEDCOM file.
- Compile a GEDCOM file showing the DNA subject's ancestors
on all sides and use the Upload GEDCOM link under your kit
number at the top right hand corner of the myFamilyTree page to upload it. If you
are not dealing with your own DNA, remember that the DNA
subject's FTDNA-overall-matches can be expected to include
not just your mutual relatives but also people related to
the DNA subject on the other side of his or her family. As a
courtesy to such people, you should include as much
information as you can for that side of the family. In my
case, this was not a burden, as I have worked with the
cousins who provided DNA samples on both sides of their
family trees in the past. (In one case, the relevant files
had to be recovered from a very old computer!)
I use Ancestral Quest to create GEDCOMs. There are lots
of
options provided. I got absoutely no help from the
FTDNA website, FTDNA
forums, FTDNA
facebook
page or FTDNA e-mail support in my efforts to work out
what options to choose. By a lengthy and tedious process of
trial and error, I initially discovered that setting 'Export
for import into:' to 'Other' and 'Char Set' to 'ANSI'
allowed accented vowels in names to be displayed correctly.
Then FTDNA changed the entire family tree interface, and it
took another year or more to learn by trial and error that
setting 'Char Set' to UTF-8 now worked.
GEDmatch.com specified clearly: "if your genealogy software
has an option to select 'character encoding', use 'UTF-8'.
Otherwise, some non-english characters may not display
properly."
I also discovered that anyone logged into the FTDNA website
can see my
own
GEDCOM, whether or not deemed to match my DNA.
- I recommend that the "About Me" field be used to direct
people to a web page, such as this one, in which you lay out
your standard reply to anyone tempted to contact you.
- Find and upload a nice headshot photograph of the DNA
subject (with his or her approval).
- Register at GEDmatch.com and DNAgedcom.com if you have not already done
so. You can manage multiple kits from a single account on each
of these sites.
- Join the relevant FamilyTreeDNA projects, both surname
projects (e.g Chambers/Chalmers) and geographical
projects (e.g. Clare Roots project, for anyone with
roots in County Clare, Ireland). If there is no project for your
surname, you can always start one.
- Make a list (with GEDmatch Kit Numbers and e-mail addresses)
of the groups of known relatives in each of the following
categories who have already submitted DNA samples and with whom
you will want to compare the results when they arrive:
- your known relatives (starting with yourself);
- your probable relatives (known to you outside of genetic
genealogy); and
- your possible relatives (discovered through genetic
genealogy).
- While waiting for results for paternal and maternal relatives,
check whether your paternal and maternal relatives might be
related to each other:
- One of GEDmatch.com's data analysis tools is "Are
your
parents related?"
For me, this clearly reported no "segment of SNPs with
greater than 500 matches".
However, GEDmatch only tells you that you did not inherit
any segment that was shared by your father and mother from
both of them. If both parents shared a segment, there
is only a 25% chance that you inherited the shared segment
from both of them. So there is a huge difference
between finding no evidence in your DNA that your parents
were related and your parents actually being unrelated.
- A more sophisticated tool is David Pike's Search
for
Runs of Homozygosity. For me, this found a longest run
of homozygosity in SNPs of length 480, from position
30087558 to position 30424959 (0.34Mb, 0.01cM) on Chromosome
6, and a longest run of homozygosity in base pairs of length
215, from position 46962428 to position 48550157 (1.59Mb,
1.38cM) on Chromosome 19. The lengths in centiMorgans are
not reported by David Pike's own tool, but can be calculated
using the GEDmatch
Genetic
Distance Calculation, also called the centiMorgan
Calculator. It would be too tedious to search manually
for the longest run of homozygosity in centiMorgans.
David Pike also has a complementary Search
for
Heterozygous Sequences. For me, this found a longest
run of heterozygosity of only 18 SNPs, from position
33161660 to position 33166752 (0.01Mb) on Chromosome 6, too
small for the centiMorgan Calculator to measure.
The difference in the lengths of the longest runs of
homozygosity and heterozygosity is staggering. Clearly
homozygosity is not independent from one SNP to the next. If
it were, given that I am homozygous at 70.403% of SNPs, then
a run of 18 heterozygous SNPs would have a probability of
the order of 10-10 but a run of 480 homozygous
SNPs would have a probability of the order of 10-72.
Although the GEDmatch threshold is 500SNPs, the figure of
480 got me wondering whether my parents might be related.
After all, both were from Ireland, where the population has
been small enough that I estimated that the probability that
any two randomly selected Irish people are 12th cousins or
more closely related is 95%.
After the results arrive for each person:
- Upload the raw data files for the new kits to GEDmatch.com;
you need to do this only once, but remember that the
hyperlinks below probably wont work.
- Login to your existing GEDmatch.com account
- In the middle column of the home
page, open in a new tab the links to FTDNA
Family
Finder and FTDNA
X-DNA and follow the instructions given.
- Download the match files from
FamilyTreeDNA.com to DNAgedcom.com; you need to repeat this
periodically as new matches appear at FamilyTreeDNA.com.
- Generate an ADSA report at DNAgedcom.com.
- Start comparing with your prepared list. For each person:
- Do a one-to-one comparison with the relevant kit numbers
at GEDmatch.com and copy the segment details to your
segments spreadsheet.
- Search the ADSA report for the e-mail address and note in
particular the segments where two half-related people on one
side of a genealogical brick wall are both half-identical to
two half-related people on the other side of the
genealogical brick wall.
An example
GEDmatch estimates that my parents were not related to each
other, so I had no reason to expect that my first cousins Antoin
and Mary would be related to each other. However, GEDmatch reports
that they share numerous half-identical regions, the longest in cM
being 4.3cM on Chromosome 12 and the longest in SNPs being 958 on
Chromosome 3. In fact, each of us is half-identical to the other
two on a region of 4.28cM and 584SNPs comprising most of the
afore-mentioned region on Chromosome 12. Standard triangulation
arguments would deduce that all three of us have a common
ancestral couple, and thus that my parents were indeed related.
Another example
As mentioned above, my first known relative to give a DNA sample
was my fifth cousin Cindy. We don't share an awful lot of
autosomal DNA. GEDmatch.com, with its then default settings,
reported these four half-identical regions:
| Chr |
Start Location |
End Location |
Centimorgans (cM) |
SNPs |
| 5 |
87,936,919 |
92,507,944 |
3.5 |
731 |
| 8 |
6,933,286 |
10,377,521 |
4.6 |
875 |
| 10 |
61,608,258 |
65,937,864 |
3.2 |
876 |
| 14 |
57,185,249 |
62,008,482 |
3.8 |
1,177 |
Perhaps we have both inherited identical segments within these
regions from our most recent common ancestral couple, our
GGGGgrandparents John Keas and his unknown wife. We also both have
earlier O'Halloran ancestors who lived within about 14km of each
other, so perhaps some of our identical segments come from a more
distant O'Halloran common ancestral couple.
The first thought that crossed my mind was to search for other
people who may have inherited any such identical segments from the
same Keas or O'Halloran ancestors.
I decided to start with the longest half-identical region on the
centiMorgan scale (the one on chromosome 8) and the longest
half-identical region on the SNP scale (the one on chromosome 14),
in the hope of finding someone half-identical to both of us in
both regions. I opened GEDmatch.com in four browser tabs and
started the Find people who match with you on a specified
segment process in each tab - two for Cindy and two for me;
two for the region on chromosome 8, two for the region on
chromosome 14. (GEDmatch.com has since removed this process as it
placed too heavy a load on its servers.) The maximum number of
hits that can be returned by each process is 301, and three of the
four ran into this limit.
This procedure eventually identified:
- one person who is half-identical to me (but not Cindy) in both
regions but who doesn't provide an e-mail address;
- one person with two separate 23AndMe kits who is
half-identical to both of us on chromosome 14;
- one person with two separate 23AndMe kits who is
half-identical to both of us on chromosome 8;
- one person with separate 23AndMe and Ancestry kits who is
half-identical to both of us on chromosome 8;
- one person with kits from all three companies who is
half-identical to both of us on chromosome 8;
- one e-mail address with FamilyTreeDNA and Ancestry kits with
different pseudonyms (LAD45 and JoanHat) which are both
half-identical to both of us on chromosome 8; and
- 23 other kits which are half-identical to both of us on
chromosome 8.
Which, if any, of these should I approach about comparing paper
trails?
The two kits with the same e-mail address seemed the most
promising, as the chance of being half-identical by chance would
be greatly reduced if they were only half-related. However, the
total of segments > 3 cM shared by these two kits is 2,799.2 cM
which suggests that they are siblings. The GEDmatch expanded
graphic confirms that they are full-identical in the region of
interest, so the second kit adds nothing to the information
provided by the first kit.
The vast difference between the numbers who match with us on
regions of 875 and 1,177 SNPs suggests that many half-identical
regions of 875 SNPs or fewer must be merely half-identical by
chance.
What I do when a possible relative's data has been processed by
GEDmatch.com
I have slowly evolved this regular manual procedure. I really
must automate it, but full automation will be prevented by
GEDmatch.com's login policy.
- add the new person to my GEDmatch.xlsx spreadsheet and note
the GEDmatch kit number in my Ancestral Quest notes
- one-to-one compare new person at 1cM/500SNP thresholds with
myself and all my known relatives who are already at GEDCOM
(Copying and pastings URLs for this generated within the
spreadsheet worked briefly, but GEDmatch policy then changed and
it is now necessary to fill in four fields in the form manually
for every comparison.)
- copy and paste matching segments and total of segments to my
Segments.xlsx spreadsheet (and fill additional columns using an
Excel macro)
- sort spreadsheet by chr, start, end
- for each known relative, filter Kit1 and Kit2 columns to show
myself, new person and known relatives
- eyeball the start and end columns to identify regions where
all three are each half-identical to the other two
- copy and paste the relevant three rows to a new spreadsheet
named PaddyNewpersonEtAl.xlsx
- if the GEDmatch centiMorgan calculator is up, calculate the
lengths of the three-way overlaps in cM using the GEDmatch cM
calculator
- calculate the lengths of the three-way overlaps in FTDNA SNPs
by manually searching for the start and end locations using
TextPad in my own Build 36 Autosomal Raw Data (which I have
saved at
C:\pwaldron\GENEALOG\Genetics\Data\310654-autosomal-o36-results.csv,
all 23,025KB of it; for some kits, this is the default file
name, but for others the default file name is ffo followed by a
very long and meaningless string of dashes and hexadecimal
digits)
- [This SNP-counting is a bit mysterious; I noticed that a
region where my first cousin and I are half-identical is
described by GEDmatch as Chromosome 6, Start 25,059,788, End
29,813,667, 2.0cM, 2400 SNPs; but when I looked at our raw data
I found that there are not 2,400 but 2,440 SNPs between the
start and end locations where both of us have clean data, plus
another 41 SNPs where one or other of us has a no-read.]
- More importantly, count the number of SNPs in the overlap at
which I and the other person are both homozygous, and so not
guaranteed to be half-identical to everyone (there is no easy
way to do this at the moment; in principle, I could do it in
Excel, but Excel is tediously slow on my top-of-the-range 2012
laptop when handling files of the size of autosomal DNA raw data
files.)
- forward spreadsheet to new person
Strategy to be followed by two people who have found a common
ancestral couple and half-identical regions of DNA
Two people who have found a common ancestral couple and
half-identical regions of DNA will naturally want to progress
their research further, both in traditional genealogy and in
genetic genealogy. This section will address how they can make
progress in genetic genealogy. The following steps are suggested:
- Find others in both the FTDNA and GEDmatch databases who are
deemed to be overall matches to both. This is a prerequisite to
Step 2, which will narrow down the list considerably.
- GEDmatch
-
Run 'People who match one or both of 2 kits' for each
pair of descendants of the common ancestral couple.
- Run 'One-to-one' compare for the new matches found with
each of the known relatives.
- FTDNA
- If the two known relatives are FTDNA-overall-matches, then
an ICW list is readily available; otherwise, the ICW list
must be generated manually.
- In the process of running the ADSA at DNAGedcom.com, each
person will have created a file named
xxxxxx_Family_Finder_Matches.csv (where xxxxxx is the
relevant kit number). An equivalent file can be generated by
selecting the Excel button at the bottom right corner of the
Matches
page. If each person copies the first column (Full
Name) from this file, some crude copying and pasting to a
Microsoft Excel spreadsheet and use of the VLOOKUP()
function will reveal kit numbers which are on both lists.
- Find others in both the FTDNA and GEDmatch databases who are
half-identical to both on the same regions. The people found in
the first step are possibly related to both of you through
different common ancestors. Those who are half-identical to you
on the same regions are extremely likely to be related to you
through the same most recent common ancestral couple.
- GEDmatch
- [The full GEDmatch.com service was down at the time of
writing.]
- FTDNA
- In the process of running the ADSA at DNAGedcom.com, each
person will have created a file named
xxxxxx_ChromsomeBrowser.csv (where xxxxxx is the relevant
kit number). Filter these files to pick out first the people
who FTDNA-overall-match both of you, and then the
chromosomes on which you match each other. Look for
overlapping regions. For each region, you need to filter for
regions which either start before your shared region starts
and end after your shared region starts, or regions which
start before your shared region ends and end after your
shared region ends. It should be possible to write a
Microsoft Excel macro to do this.
Form letter for first contact with a possible relative (not at
ancestry.com)
Dear Charles
I found your e-mail address at FamilyTreeDNA.com (where I am
Patrick Joseph Martin Waldron)/GEDmatch.com (where my kit number
is F310654) and I believe that we may be related.
Our autosomal DNA is half-identical on the following region(s):
| Chromosome |
Start |
End |
centiMorgans |
SNPs |
| 17 |
9,185,149 |
12,566,303 |
11.5 |
1,068 |
Furthermore, we are part of a group of three people, also
including ..., who are each half-identical to the others on the
... of these regions.
I have uploaded a copy of my family tree database (as it was on
24 Feb 2014, minus the details of living people) to
http://pwaldron.info/tng/
You can Register for a User Account at
http://pwaldron.info/tng/newacctform.php
Furthermore, ... and I are known relatives (9th cousins twice
removed). Our most recent common ancestral couple are Richard
Blackall and his wife (whose maiden name was also Blackall).
Richard came to Ireland from England during the reign of Charles I
of England (1625/1649) and settled in county Limerick.
... and I have another possible but unconfirmed relationship
through Robert Blakeney (d.1658/60) and his wife Susannah Ormsby
(d.1659) of Castle Blakeney, county Galway; if that is confirmed,
then it would also make us ninth cousins twice removed.
Once I have approved your registration on my TNG website, you
will be able to see exactly how ...'s GGGGGuncle and I are related
at
http://pwaldron.info/tng/relationship.php?secondpersonID=I1&primarypersonID=I11731
and how ...'s GGGGGuncle and my possible GGGGuncle are related at
http://pwaldron.info/tng/relationship.php?secondpersonID=I33441&primarypersonID=I11731
from where you can navigate around the tree and look for a
possible link to your own known ancestry.
In ...'s version of the family tree, he is at
http://trees.ancestry.com/tree/6240035/person/-1324643958
the son of our common ancestral couple is at
http://trees.ancestry.com/tree/6240035/person/7017465396
and the grandson of our other possible common ancestral couple is
at
http://trees.ancestry.com/tree/6240035/person/24046251078
I have looked at your GEDCOM file at
FamilyTreeDNA.com/GEDmatch.com. I have (not) found any common
ancestor.
/Where can I see your family tree so that I can search for our
possible common ancestral couple?
I have four known relatives whose DNA is, or shortly will be,
available for comparison:
- my paternal first cousin ... (GEDmatch kit number ...);
- my maternal first cousin ... (GEDmatch kit number ...);
- my paternal fifth cousin ... (GEDmatch kit number ...); and of
course
- my ninth cousin twice removed ... (GEDmatch kit number ...).
What known relatives do you have whose DNA is available for
comparison? If you don't have any yet, I recommend that you
encourage at least one paternal relative (if still living, a
paternal grandparent, greatuncle or greataunt, father or paternal
cousin) and at least one maternal relative (if still living, a
maternal grandparent, greatuncle or greataunt, mother or maternal
cousin) to submit a DNA sample for analysis.
If you have not already copied your DNA data to GEDmatch.com, I
recommend that you do so. I also recommend the Autosomal DNA
Segment Analyzer at
http://www.dnagedcom.com/adsa/
and my own account of my experiences with autosomal DNA at
http://pwaldron.info/newdna.html
Yours sincerely
Paddy Waldron
Form letter for first contact with a known relative at
ancestry.com
Dear John
You show up as a DNA match to your fourth cousin Paddy Waldron,
whose AncestryDNA kit I manage, as I am his cousin on the other
side of his family.
He also has his DNA at FamilyTreeDNA.com and GEDmatch.com and
would love to hear from you directly by e-mail at ...
He has a vast amount of information on your common McNamara
ancestors which he will be delighted to share.
Form letter for second contact with a known relative at
ancestry.com
Dear John
Thank you very much for your e-mail.
I am very anxious to look more closely at our shared DNA segments
and see what we can learn from them about our ancestors and other
common relatives, but first let's share what we know of our common
ancestors.
You might enjoy the account of how I became aware of my
relationship to the Kunzmann family through the Talty Millions
case, at
http://pwaldron.info/oks/
I have uploaded a copy of my family tree database (as it was on 18
Oct 2015, minus the details of living people) to
http://pwaldron.info/tng/
You can Register for a User Account at
http://pwaldron.info/tng/newacctform.php
Once I have approved your registration on my TNG website, you
will be able to see exactly how we are related at
http://pwaldron.info/tng/relationship.php?secondpersonID=I1&primarypersonID=I61141
from where you can navigate around the tree.
I have looked at your own family tree at
http://trees.ancestry.com/tree/79437082/family?cfpid=34401375965
We have two other known mutual relatives whose DNA is available
for comparison at GEDmatch.com and FamilyTreeDNA.com but not at
Ancestry.com
- my paternal first cousin ... (GEDmatch kit number F335377);
and
- our fourth cousin twice removed ... (GEDmatch kit number
F221835).
What other known relatives do you have whose DNA is available for
comparison? If you don't have any yet, I recommend that you
encourage at least one paternal relative (if still living, a
paternal grandparent, greatuncle or greataunt, father or paternal
cousin) and at least one maternal relative (if still living, a
maternal grandparent, greatuncle or greataunt, mother or maternal
cousin) to submit a DNA sample for analysis.
If you have not already copied your DNA data to GEDmatch.com, I
strongly recommend that you do so. I also recommend my own account
of my experiences with autosomal DNA at
http://pwaldron.info/newdna.html
I will do my best to answer any other questions that you may have
about our common ancestors or about DNA.
Yours sincerely
Paddy Waldron
Form letter for reply to first contact from a possible relative
Dear Nancy
Thank you for your e-mail about our possible DNA match.
You neglected to mention in your e-mail which of the many DNA
kits associated with this e-mail address on several different
websites you are writing about.
First, we need to know each other's GEDmatch.com kit numbers.
I used the GEDmatch User Lookup tool to search for your kit
number(s), but it does not recognise your e-mail
address. What is your GEDmatch.com kit number?
You can use the same tool if you need a reminder of the long list
of kit numbers associated with this e-mail address. Which of them
do you match?
Second, we need to see each other's online pedigree charts.
My own is at
http://pwaldron.info/tng/pedigreetext.php?personID=I1&generations=5
In order to see it, you will have to first register at
http://pwaldron.info/tng/newacctform.php
and then wait for an e-mail confirming that I have approved your
registration.
Where is your online pedigree chart?
Finally, you may find the answers to other questions that you
might want to ask me about DNA testing on my website, starting at
http://pwaldron.info/DNA/nextstep.html
Best wishes
Paddy Waldron
For my further thoughts on this subject, see Measuring the length, the rarity
and the relevance of pieces of shared autosomal DNA.
My own online family tree is at http://pwaldron.info/tng/index.php
but to see it you will have to Register for a
New TNG User Account.
Comments about this page can be left on the facebook posts where
I originally announced Chapter
1 and Chapter
2.